
It’s not enough merely to decide to implement data analytics for marketing your business, you need to also ensure its proper implementation to meet your objectives. That’s a job easier said than done. Once a company has embedded analytics in its marketing process, it’s very important not to lose track of the implementation, or else, its efficacy could be blunted.
From experience, we can say that there are some elementary, and then, not so elementary mistakes business managers make while implementing marketing analytics.
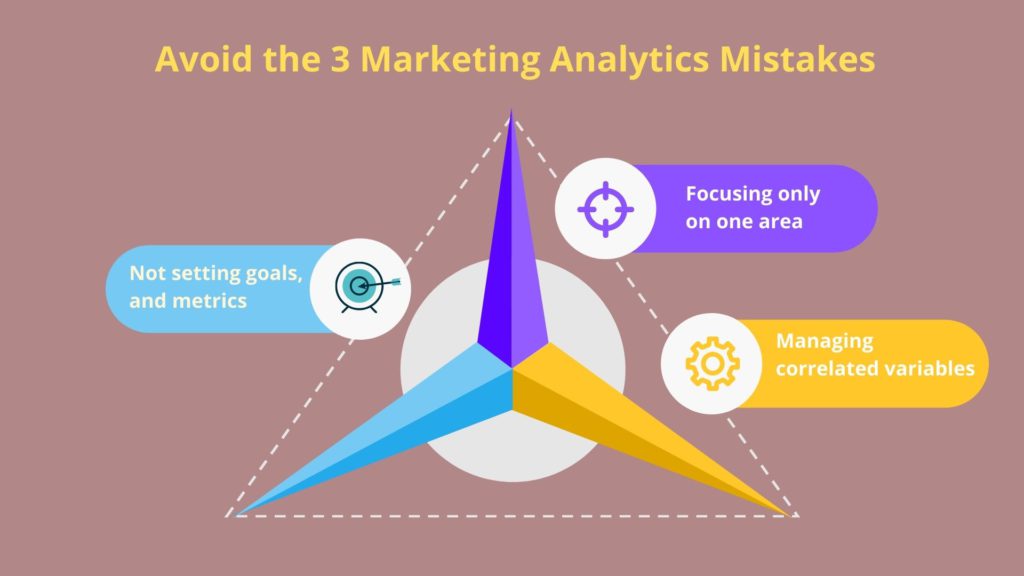
We list a few of them here:
Mistake 1: You fail to spell out the specific goals of your campaigns
This is a classic blunder that marketers make – not really knowing why they are measuring a specific set of activities or metrics. The goals must be written down at the start of every marketing campaign, along with clearly stated benchmarks for measurement, which will eventually show whether the campaign was successful or not.
Not knowing why a set of metrics are being tracked means a waste of resources. Sometimes, even the same marketing metrics can be tracked to attain different goals.
Knowing your metrics and what value you want to get out of them is the first challenge of any deployment of analytics in marketing. One of the easiest ways forward on this front is to break it down into simple question-answer forms. Ask yourself, or your team, questions related to the particular marketing activity. Why are we launching A/B testing around XYZ advertisement, will bring in more focus than simply deciding to launch such a test, right?
Mistake 2: Not everything that correlates points to something
Readers must have heard the phrase – it’s like comparing apples and oranges. This is what one needs to guard against in data analytics. Do not mistake correlation for causation. What does that mean? To put it in plain words, just because two metrics in your analysis register a growth or decline at the same time does not mean they are related.
Correlating metrics is one of the biggest Mistakes of marketing analytics. Often, large data sets contain several similar or near-identical observations that can be interpreted (wrongly) as a correlation, leading to managers putting forth an erroneous hypothesis, eventually.
Here’s an example: The analysis of your raw data may show that the terms ‘Shoe’ and ‘Yoga’ were searched most often in search engines but to jump to a conclusion that the increase in search for both terms (whose meanings you are previously aware of) are inter-related, and causation somehow played some role in it, would be wrong.
See the challenge, here? The difficulty of verifying whether otherwise causal relationships within large pools of data are linked or not, based on which you can then initiate some marketing action, is something that every data analyst faces. Studies in the past and the experience of data analysts have shown that such ‘correlations’ are bound to crop up in the world of big data. Take the rapidly evolving field of machine learning, for example. MI-based algorithms may throw up correlations on analysis of data but are these superficial or casual is something that the data analysts need to understand first, before initiating any action.
So what have we learned here? Finding associations between metrics is a good method but marketers and data analysts have to guard against illogical inferences when they find a set of metrics increasing or decreasing, simultaneously. All correlation does not always imply causation.
Mistake 3: Failing to visualize your data correctly
That’s right. At the end of it, all lies data visualization to deliver the results to the team and audience. And that can be a complex task. Visualizing data helps you capture your results and share them. Not doing that properly can lead to the misrepresentation of data or perhaps, even convey half the message.
Good data visualization is all about presenting the data in a way that’s not only easy to grasp but also saves the person looking at the dashboard time and effort. Which means the presentation of information in a visually pleasing and easy-to-understand manner.
If data isn’t properly visualized, it can do more harm than good. That’s why good data visualization relies on good design. It’s about presenting information in a way that is easy to understand and intuitive to navigate, taxing the viewer as little as possible.
Some of the other common mistakes in marketing analytics
Casualness creeping into the process: Once you have those analytics going, there is often the danger of the status quo creeping in. Meaning – the reluctance to tweak marketing metrics to be in sync with existing market conditions.
Not prioritizing data quality: “Garbage in, garbage out” is a well-known adage. The same is true for data analytics. Proper data maintenance is an absolute priority if you want to get the analytics right. Data must be quality-controlled, sorted, and meta-tagged before processing.
Similarly, poorly structured data architectures can make retrieving the data for study difficult. Most marketing teams end up with data silos, where information from campaigns is not shared, leading to difficulties in the ability to obtain insights.
Like what you just read? Why don’t you become a subscriber? Click below.
An Engine That Drives Customer Intelligence
Oyster is not just a customer data platform (CDP). It is the world’s first customer insights platform (CIP). Why? At its core is your customer. Oyster is a “data unifying software.”
Liked This Article?
Gain more insights, case studies, information on our product, customer data platform