
Building an effective What If Analysis Model: Uses, Types, Benefits, Examples
For corporates to test a hypothesis, they need to conduct a What-If analysis scenario. This technique of What-If scenario helps companies evaluate in advance the result of a planned strategic or tactical move.
Also known as sensitivity analysis, What-if Models are also used to understand whether changing the inputs in that model also changes the outcomes.
In order to test the effectiveness of a strategy, data-intensive simulations such as What-if analysis are used to find out the behavior of complex systems in the company as a whole or a part, while playing out pre-determined hypotheses called “scenarios“.
Thus, by creating a hypothetical world with a formulated scenario, the What-if analysis analyzes how changes in an independent variable affect a set of dependent variables, which the analyst can then further examine.
Table of Contents
- Where What-If Analysis is Used
- How What-If Analysis is Used
- Efficient What-If Analysis
- Examples in Excel of What-If Analysis Model
But this post is not about picking the right type of data visualization chart or tool.
Instead, today, we will be looking at what it takes to design an effective ‘What-If’ analysis, an example of the relationship data visualization technique.
Want to dive deeper into What-If scenario analysis? Get in touch with our experts.
What is What-If Analysis (what-if analysis)
What-if analysis is the method of mathematically establishing the effect of a particular process on an organization, given a predefined situation. In layman’s terms, this type of analysis “juices up” analytics by using a, ‘if this, then what, method.
Like analytics guru Avinash Kaushik has put it in one of his recent blog posts:
“…. if you create exploratory environments it can be exceedingly accretive to decision-making if we build in what-if type models. Rather than stopping at an end-point, provide an option of doing some type of sensitivity analysis with the goal of prodding the audience to take action.”
Where What-If Analysis is Used
Where is the What-If analysis module used? You might be familiar with financial modeling. A robust financial model provides an analyst a way to manage a business’s operations, and analyze the results over time (historically) as well as cross-sectional – measuring the company’s performance against that of the competition.
The analyst will input both historical data and assumptions about future performance. From there, you can derive various ratio analyses and other performance metrics such as profit margins, inventory, cash in hand, etc.
Using the What-If analysis, a company’s management can toy around with different circumstances, using any two assumptions, to observe their effect on the financial model.
A What-If analysis also adds more flexibility to one’s financial and valuation models when it comes to analysis and presentation. What’s more, this kind of analysis can be used to predict the outcome in almost all possible departments – Marketing, Sales, and even HR.
How What-If Analysis is Used
To cut short all the mumbo jumbo, a What-If analysis helps an organization best determine its next move in the market, based not on some hunch but on cold, historical facts.
Example of What-if Analysis: The head of a marketing team adds these two variables to understand the impact on the bottom line: (a) Add 20 marketing people (b) Over the next 6 months.
The question he thus seeks an answer to is: What if I employ 20 marketing people in the next 6 months? Will it boost revenue, and if so, by how much?
Conversely, companies can use What-If analysis modelers to also reduce the business risks, inherent in all operations. Risks come in all forms and can catch business operations unawares – disruption in the supply chain, and weather breaks, are some of the examples of What-if analysis.
By inputting variables and analyzing the outcome, a company can surely reduce its impact on the overall business.
Grow your business operations using our data cleaning services
Essentially, as Kaushik says, What-If adds that “extra” factor; there’s no need to make data visualizations with dead-ends.
Efficient What-If Analysis
Now that you know what can be done in What-If analysis, you also need to know what goes into understanding it. To make your team understand the outcome, you need to ensure your situational modeling has:
- Simple exploration
- Minimal variables
- Easy to grasp findings
Most data analysts will tell you there’s a tendency to go overboard with complex variables. This makes figuring out possible changes much harder. The questions you ask of your data to forecast the future are also the key. Too many questions or too complicated a query will surely complicate things.
If you are drawing up such a sensitivity model using the traditional Excel sheet method for example. Rather than entering variables or formulas individually to compare results, you can set up a data table with one or two variables at most. Data tables, by the way, are one of Excel’s ‘What-If Analysis’ features.
They are a range of cells set up so you can plug and play with values and come up with different answers to a problem. Using data tables, you may create one or two variable tables; it all depends on the number of variables and formulas up for testing, the output of which can be seen in the results cell.
Next: Whether you use Excel or charts or graphs, your audience or stakeholders also define the explanation of the outcome. You have to make sure that the data visualization is made so that your audience will understand it; otherwise, the whole effort is likely to do down the drain.
The visualization model must clearly indicate the baseline (actuality), from where the analysis departs to talking of the future.
Examples in Excel of What-If Analysis Model
We can easily demonstrate how a What-If analytic model works in Excel with easy steps.
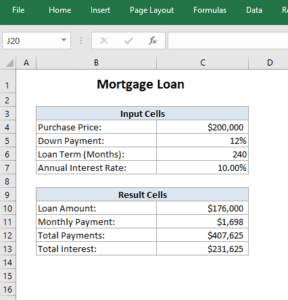
In figure 1, we can see a basic Mortage Loan calculator we have designed. In the example, we see the monthly payment of a mortgage using our initial variables will be $1698. But what if we want to see how changing the terms of the loan affects our monthly payment?
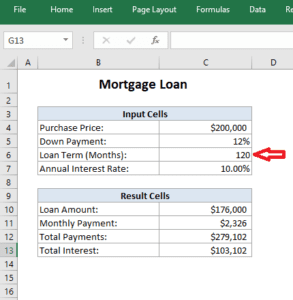
In Figure 2, you can see I changed the loan term to 10 years (120 months). This recalculated the monthly payment to $2326. But, the Total Payment for the mortgage is reduced.
In Figure 3, we change the loan so we only pay 10% as a down payment. Now, the monthly payment is $1737, but we end up paying more in the long term.
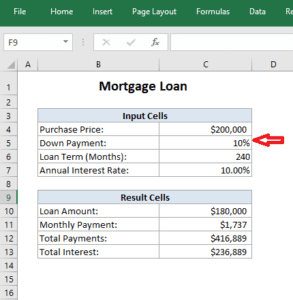
This is a What-If Analysis example in its simplest form.
(Quick tip: Want to get going quickly in Excel? Select the ‘Data’ header tab, then select the ‘What-If’ tab on the far right side of the toolbar.)
Before signing off, I leave you with the interesting scenario analysis of ‘The Future of Burgers’ by Katrina Scicluna and Felix Zappe, at the Edward de Bono Institute, University of Malta. Scicluna and Zappe were able to find two key drivers to how burger culture was changing. These two drivers were
- new technology changing the production of burgers
- the popularization of organic foods was changing consumer patterns.
An eye-opener, indeed.
3 Types of What-If Analysis in Excel
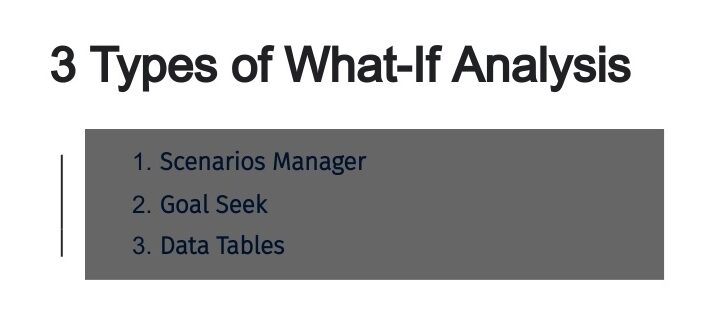
There are 3 types of What If Analysis tools that appear with Excel:
- Scenarios
- Data Tables
- Goal Seek
Scenarios and Data Tables catch sets of input values and project onward to decide a probable outcome. Goal Seek varies from Scenarios and Data Tables in that it receives an outcome and projects backward to establish probable input values that construct that result. If you are familiar with the result that you expect from a formula, but are not confident about what input value the formula requires to obtain that result, utilize the Goal Seek feature type.
You can exercise Goal Seek to decide what interest rate you will require to lock in order to assemble your loan objective.
A data table is a series of cells in which you can modify values in a few of the cells and appear with different responses to a problem.
Every scenario can contain up to 32 variable values. If you wish to examine more than 32 values, and the values show only 1 or 2 variables, you can exercise Data Tables. Though it is partial to only 1 or 2 variables, a Data Table can contain as many different variable values as you wish. A scenario can have a highest of 32 different values, but you can generate as several scenarios as you wish.
Today’s successful companies are highly proactive in customer experience. If your business wants to taste the same degree of success, it needs to tap into the power of scenario analysis. To run your ‘What-if’ scenarios, you need to look no further. Our customer data platform Oyster is here to help.
To know more, click here