A Comprehensive Guide To Predictive Analytics
To predict means to forecast. So just imagine if a business, whose eventual aim is to make a profit, could foresee what lies ahead? Predictive analytics offers that scientific crystal ball.
This form of analytics involves the aggregation and analysis of historical data to foresee future outcomes. In fact, many call predictive analytics can be called the proactive part of data analytics.
Predictive analytics uses several techniques and tools to arrive at a conclusion about the future. It uses data, algorithms, and, these days, machine learning techniques to provide the best scientific evaluation of what lies in the future.
But this form of analytics is not a new concept. Predictive analytics was being used by statisticians by way of decision trees and linear/ logistic regression for the correlation and classification of business data and to make predictions.
But predictive analytics has come into the mainstream for two reasons: for easy access to technology that can not only draw but analyze large volumes of data, and also because of tech like machine learning, a subset of artificial intelligence.
These developments have led to the use of predictive models in areas where it was hitherto not possible to do so.
Why Predictive Analytics?
To reiterate, predictive analytics has been around for years but it’s only now that many more organizations are turning to it. Here are the reasons why:
To cope with the voluminous data, today there are faster computers, cheaper tech, and easy-to-use software, all of which make the deployment of predictive analytics easier.
Predictive analytics also help in identifying new shifts in consumer behavior and growth opportunities. Marketers can use it to gather insights into an industry and spot new trends so that they can model their product or service as per the customer’s requirement.
Looking to upgrade your business to a higher level?
Predictive Analytics Use Cases
Slowly but surely, enterprises are turning to predictive analytics to uncover new openings.
Here are some of the common use cases:
Optimizing marketing: Based on a customer’s previous habits, actions, and purchases, predictive analytics is used to retain and grow the most profitable customer base. This approach also helps cross-sell and up-sell.
In retail specifically, e-commerce sites use predictive analytics for merchandise planning and price optimization or to analyze the effectiveness of advertising campaigns.
An example: Amazon uses predictive analytics-driven digital marketing to recommend products to members based on their past behavior, and increases its sales by as much as 30 percent, say studies.
Preventing fraud: Using different analytics methods, including predictive analytics, enterprises like financial institutions can enhance pattern detection and prevent criminal behavior.
Predictive analytics can spot irregularities that may show fraud and advanced threats. Banks use this form of analytics to detect and reduce fraud, measure credit risk, and retain valuable customers.
In the Health sector, specifically, predictive analytics is used to unearth claims fraud, and to identify patients most at risk of chronic disease.
Improving operations: Travel and tourism, so also the hotel industry use this kind of modeling to manage inventory and resources. For example, airlines use this form of analytics to set ticket rates in real-time. On the other hand, hotels use it to maximize occupancy and increase business.
Here are some important aspects to keep in mind while deciding to integrate predictive models:
- Data-gathering
- Data-cleansing
- Analysis
- Creating action plans based on analysis
- Executing on plans
Predictive Analytics Techniques
Broadly speaking, there are three techniques for predictive analytics: decision trees, regression, and neural networks.
Decision trees are one of the oft-used modeling techniques because of their simplicity of use. Unlike other forms of supervised learning algorithms, this particular algorithm can even be used for solving regression and classification problems.
This model is basically a rule-based approach where a tree-like structure is created. Learning starts from the top of the tree (i.e. the root node). Each node basically consists of a question, to which the answer is positive or negative. The questions at different levels are related to the different attributes in the dataset.
Based on the answers at different levels of the tree, the algorithm reaches a conclusion as to what should be the output corresponding to the input sample.
Regression is yet another popular modeling tool. There are two types: linear and logistic regression. They are used to find correlations between variables in data analysis. It is also the most popular machine learning algorithm because of its ease of use.
Linear regression modeling is based on regression capabilities that change depending on the number of independent variables and the type of relationship between the independent and dependent variables. There are two types of linear regression models: simple and multiple linear.
Logistic regression is used to solve binary classification problems where there are two class values. A Logistic Regression can be referred to as a Linear Regression model but the former uses a complex cost function which is called the ‘Sigmoid function’ or ‘logistic function’ instead of a linear function.
The sigmoid function plots any real value into an alternate value in the range 0 to 1. In machine learning, the sigmoid (the S-shaped curve) is employed to map projections to probabilities.
Using logistic regression, you can make simple predictions to forecast the probability that an observation belongs to one of two possible classes. An example would be to look at historical records of a bank customer to understand whether he may or may not default on his loan repayments.
Neural networks may be used for solving problems the human brain is very good at, such as recognizing sounds, pictures, or text. They can be used to extract features from algorithms for clustering and classification, essentially making them modules of larger machine learning apps.
An artificial neural network (ANN) is a predictive model designed to work the way a human brain does. In fact, ANNs are at the very heart of deep learning. Deep neural networks (DNN) can group together unlabeled data based on similarities existing in the inputs, or classify data when they have a labeled dataset to train on.
What’s more, DNNs are also scalable, best suited for machine learning tasks. Using these, we can build extremely accurate predictive models for predictive analytics.
Predictive Analytics in Marketing
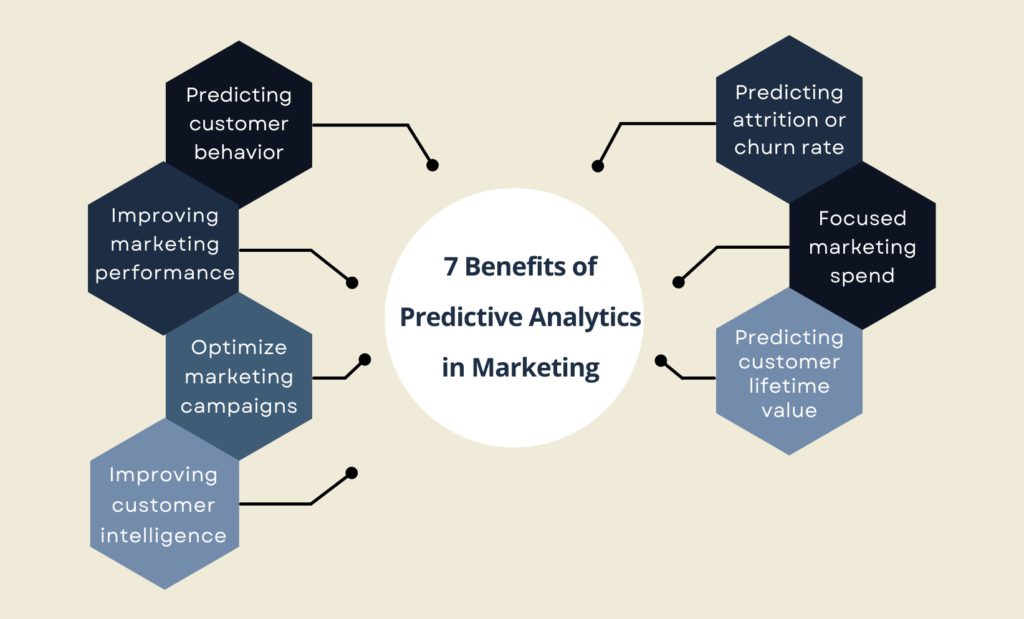
To be successful in marketing, a business needs to understand the importance of creating a winning marketing mix strategy for a product/service. Marketers have long leveraged data to measure the ROI of a campaign.
Over the decades, they have gotten more advanced. Predictive analytics optimizes marketing campaigns to stop customer churn, increase their responses and conversions.
Initially, marketers used media mix modeling, which helped them understand the long-term impact that a campaign had on sales. Then, as data analysis advanced, they moved on to more complex attribution models, including the multi touch attribution (MTA) model which helped them understand consumer paths to purchase.
Multi touch attribution is to measure and acknowledge the various touchpoints prior to the closure of a sale in a customer’s journey – at every stage of the marketing funnel – from product/service awareness to lead creation to nurture to conversion.
Traditional first or last-click attribution methods are no longer enough, and you need to immediately replace those with the multi touch attribution system.
If you want an even more technical explanation, here’s how research agency Forrester defined multi-channel attribution once – it’s the science of using advanced analytics to allocate proportional credit to each marketing touchpoint across all online and offline channels, leading to the desired customer action.
In digital marketing, predictive analytics means using statistical analysis, algorithms, among other techniques on both, structured and unstructured data sets to develop predictive models. This is further helped with the advancements in artificial intelligence and machine learning.

What are Predictive Models?
Data analysts are able to build predictive models after they have enough data. Using predictive analytics, one can give a predictive score to each customer. This is by a predictive model which, in turn, has been trained by your data. Predictive modeling is a process that uses data and statistics to predict outcomes with data models.
Predictive modeling refers to the use of algorithms to analyze data collected on previous incidents in order to predict the outcome of future events. In a business model context, this is most commonly expressed as the analysis of previous sales data to predict future sales outcomes, then using those predictions to dictate what marketing decisions should be made.
Benefits of Predictive Modeling
The largest advantage you can gain from using predictive modeling is how easy it is to generate actionable insights; because the insights gained from predictive modeling are solely based on the truths of your organization’s actual business behavior, it is tailored specifically for your business’s needs and strategies.
The other major advantage of predictive modeling is the value it offers to optimize marketing spend; by using predictive modeling to determine which customers in your customer base have the highest proclivity to buy, you can better plan out your marketing campaign to avoid wasting money on segments that are not likely to provide sufficient return.
Looking to upgrade your business to a higher level?
Why Do I Need Predictive Modeling?
To illustrate how key predictive modeling serves in optimizing your organization’s marketing strategy, let’s consider an example. Suppose you were a business that publishes a catalog every quarter to advertise your new line of products to your customer base.
If it costs a little over fifty cents (postage is $0.47 for the US, and printing en masse is likely around $0.03 per catalog at minimum) to print, and you have a total customer base of around 100 million customers, you are essentially looking at spending $50 million a quarter to send a catalog to every customer you currently have in your database.
In order for this marketing campaign to break even, you would need to receive more than $50 million in revenue in return for this ad campaign. Obviously, it would be absurd to justify doing this once, let alone every quarter.
Your marketing strategy works best when you minimize costs and maximize return, so for this campaign to be effective, you need to focus on the customers most likely to buy. We need a mechanism to identify our best customer segments, and we can use their historical buying behavior and predictive modeling to determine this.
How to do Predictive Modeling?
At their core, humans are creatures of habit; the reasons that caused them to buy from you in the past will be the same reasons they will buy from you in the future. Therefore, you can leverage what you learn from their past buying behavior to position yourself such that you meet their future desires.
Predictive modeling breaks down into a few key steps:
First, all previous data collected is analyzed to determine what patterns or parameters the customers you already have followed, and thus what patterns both they and your future customers will follow.
Next, You can use this predictive model to see which marketing campaigns in the past have seen success with each different segment of your customer base.
Finally, you can determine which products that were advertised during each campaign did or did not successfully see a rise in sales, which in turn translates to whether those products have a reasonable chance of success if advertised; after all, if a product gets advertised for your marketing but does not see valuable results, it would be better to emphasize other products.
Best Approach to Predictive Modeling for Marketing
Predictive modeling offers a customized approach for marketing. A-One sizes fit all approach is usually not ideal for your marketing strategy, as the needs your business, in particular, has might differ heavily from what works in a vacuum.
Instead, you need to customize your models as per your business requirements and do plenty of data wrangling and analysis before implementing the model.
Predictive Analytics Software
Normally, it would be safe to say that predictive models are just one type of advanced analytics. There are others like RFM and identity resolution that are not predictive in nature.
They fall into statistical models (RFM), optimization models (Attribution), cluster or segmentation models. Together, we call them advanced analytics.
For predictive modeling data is used from the following sources:
- Transaction
- CRM
- Customer service
- Digital marketing and advertising
- Demographic
- Web traffic
Developing Lookalike Predictive Analytics Model To Know Your Valuable Customers
Now, for readers to understand how a predictive analytics model actually works, we shall discuss and develop the “Lookalike Model”. In the business context, this kind of modeling is to find new customers who exhibit characteristics similar to your best profitable customers.
For the purpose of this exercise, let’s have a hypothetical e-commerce store, and the following facts as a baseline: the best/valuable audience is people whose average purchase is $150, and who purchase thrice a month.
Now, then, we shall use the Lookalike Model to find more customers who meet these criteria. Thus, the Lookalike Model is to forecast whether the new customer is as valuable as your existing valuable customers.
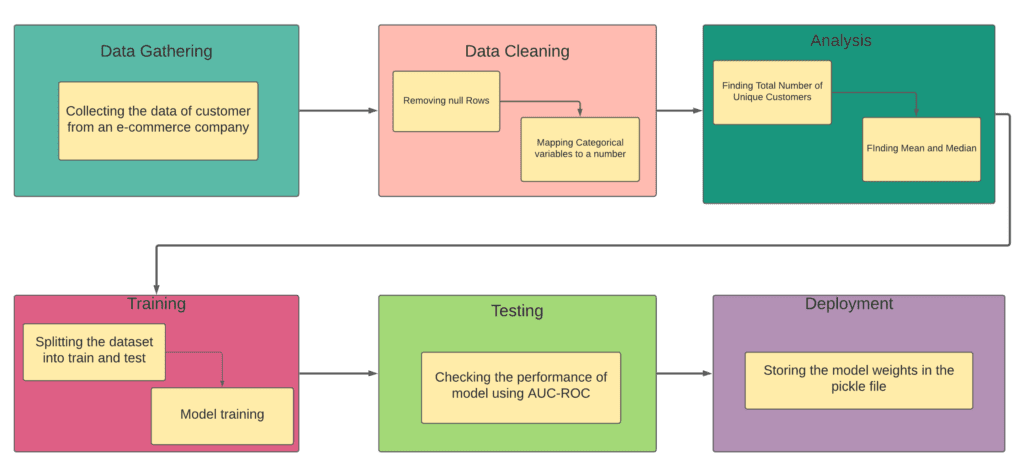
In order to build a Lookalike Model for an e-commerce platform, our data analyst Pankaj Katkar performed the following steps:
Data Gathering:
The lookalike Model works by utilizing data and algorithms. As the first step, he gathered the data of the incoming customers. Remember, you need to collect the proper characteristics of the customer for better performance of the model. Some of the characteristics you can collect are:
- Transaction channel
- First transaction revenue
- Distance from the offline store
- Product department
Data Cleansing:
After gathering the data, we cleaned the data by removing the rows having ‘null’ fields or replacing them with other values. If you have any categorical variable in your data, map it to an integer. Then, we analyzed the values stored in the fields.
Again, remember, if they don’t match the required type, convert them to the required type or replace them. When this is done, your data will be in the proper format for further processing.
Analysis:
After cleaning the data, Pankaj did some analysis on this data. He first found out the number of customers in the dataset. He further dug down and found out the mean and median of the 1st transaction revenue column in the dataset.
From the “Product Department” column, he found out the number of departments, and which of the four departments had the most number of purchases. Further, he also found out from which department the valuable customers purchased the most, and what was the average money they spent.
Training Predictive Model:
By doing all the above, he now had the data of all customers along with all the features and also their Customer Lifetime Value Score (CLTV) score from the CLTV model, which tells you which of your customers are highly valuable.
Remember, if you don’t have the CLTV score, run a CLTV model on your dataset and calculate the CLTV score as we will need the customer’s CLTV score to classify them as (a) highly valuable customers and (b) not so valuable.
Now, for building our model, we converted our dataset into the train (80%) and test (20%) dataset. The Lookalike Model becomes the predictive analytics problem. It is based on this data that you can build the model to eventually predict whether a customer was highly valuable or not.
Testing The Model:
We tried the following model on the dataset:
- XGBoost
- Random Forest
- No Model(Random Selection)
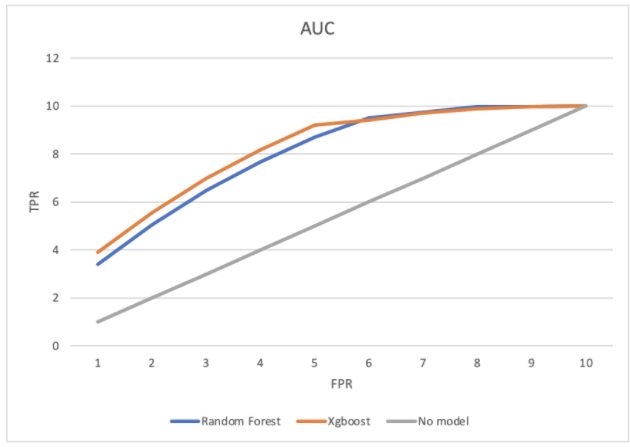
Pankaj considered the AUC-ROC metric for comparing the performances of the models. AUC-ROC is the performance measurement for the classification problem. ROC is a curve and AUC represents the degree of separability. It tells how much the model is capable of distinguishing between the classes. Higher the AUC, the better the model.
Below is the ROC curve for our models:

We noticed that the AUC under XGBoost was higher than the other models, so XGBoost was performing better compared to other models.
Thus, in this way, you, too, can build a Lookalike Model to predict whether a new client will be valuable or not. After building the model, you need to simply enter the characteristics of that new customer to forecast that. It means going ahead, your business can then concentrate on this group of customers, thus saving valuable resources.
Deployment:
For the deployment part, we stored the model in a pickle file, to store the weights of the model. Thus, when we want to use this model, we can load the weights and start using it.
Below is the entire flow diagram of the whole process:

Clearly, while nobody can really predict the future, businesses can, at least, use predictive analytics to examine existing data and determine an outcome in the future.
Once you deploy a predictive model like we did above, depending on your historical data, other incoming data, data sources, and ML algorithms, the model can suggest actions to be taken in the future.
An Engine That Drives Customer Intelligence
You can now develop predictive models using the Express Analytics CDP Oyster. It is the world’s first customer insights platform (CIP). Why? At its core is your customer. Oyster is a “data unifying software
Liked This Article?
Gain more insights, case studies, information on our product, customer data platform


No comments yet.