Integrating data visualization and reporting approaches can offer a balanced strategy for conveying the information clearly.
Our data experts can help you increase ROI in data via skilled data analytics implementation, testing, experimentation, and data storytelling via data visualization.
We can find major metrics and KPIs to ensure your visualizations are actionable and relevant.
Data Reporting and Visualization
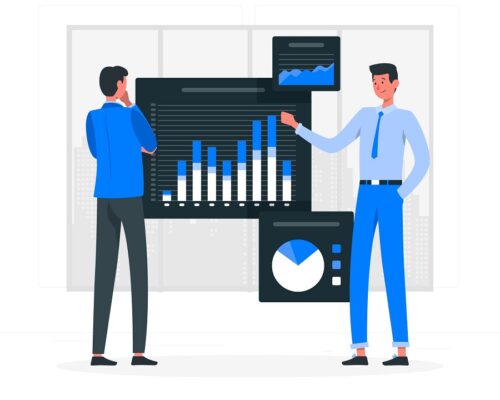
Data Reporting and Visualization Include

CIP = CDP + CI + AI = OYSTER Visualize
- Tracking and measuring your big data is easy with Oyster one-login, one-screen dashboard and reporting consoles.
- Once data feeds are pulled in from the client-end, our in-house infographic designer provides you with chart and graphs, consumable on any device.
- So it’s very easy for marketers to see and understand how their email campaigns are doing or how the sale of a product is performing, or measure the impact of all prospect or customer touch points.
Customize
- Oyster dashboard allows users to customize or highlight any aspect.
- Plus, we have made it easy to configure and edit them so that reports and infographics can be shared.
- Users can apply various filters and drill down easily with dynamic views.
Let's Find the Story of Your Data using Visualization Services
An image is worth a 1000 words visualization your data is worth 10,000
Blame it on the brain. Because of the way it’s wired, humans tend to processes complex data put in charts or graphs faster than spreadsheets or reports.
Visualization is the best way to convey data-related concepts and reports. In a sense, data visualization is form of creative data exploration.
Our Oyster platform offers real-time, custom dashboards, using actionable information from systems such as Salesforce.com, Oracle, Marketo, and Google Analytics.
Oyster dashboards help you understand factors that influence customer behaviour, measure success of your marketing channels and measure and predict sales volumes.
Oyster is a marketing performance management solution that gives marketers the ability to plan and predict and measure campaign results – which means measuring the actual impact of marketing spend on revenue.
Types of Data Reporting and Visualization
Oyster reporting consoles and dashboards help you measure what matters to you in real-time so you can make better, faster decisions.
Marketers can use SCORE to know which campaigns work and which don’t in order to take corrective steps.
With our complete data visualization and reporting services, businesses will experience:
- Greater confidence in the perfection of visuals
- Less consulting and IT dependencies
- Lower support and ongoing training
- Reduced maintenance costs


