Investing in customer lifetime value isn’t simply about numbers—it’s about building and maintaining meaningful customer relationships that last long.
Customer Lifetime Value
Understand Your Customer’s Buying Profiles And Value Them With Laser-Precision Accuracy.
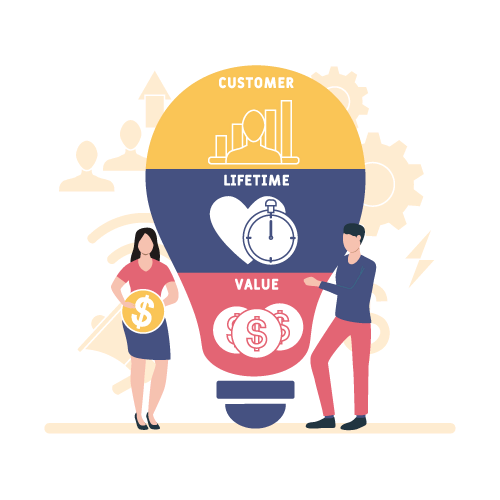
What Exactly is Customer Lifetime Value (CLV) Model ?
Customer Lifetime Value (CLV) is a primary metric for understanding your customers. It’s a predictive calculation of the value your relationship with a customer can bring to your business. This approach allows organizations to demonstrate the future revenue they can generate from their marketing initiatives.

Analytics Powered Customer Lifetime Value
- EA’s CLV module gives you the unique advantage that independent CLV solutions just can’t match.
- When combined with customer lifetime value analysis, we monitor the past behavior of customers but predict profitability in the future.
- This dynamic combination allows businesses to:
1. Personalize engagement: Customize experiences that encourage repeat purchases.
2. Target valid customers: With our valuable insights, you have to focus on customers who bring value over time.
Precise CLV (Customer Lifetime Value) computation for brand-new customers
- Harness the power of EA’s deep neural networks to accurately predict the Lifetime Value of your brand new customers with nothing but their first-transaction data.
- Our modern CLV computation uses ML models to predict lifetime value with accuracy from minimal data points.
- Our CLV model lets you to:
a. Find high-value prospects at the early stage
b. Allocate resources properly - Precise customer lifetime value computation includes examining major factors such as:
a. Engagement trends
b. Initial buying behavior

Unforeseen Churn Prediction
- EA lets you predict the finite lifetime value of those customers who are about to churn in the near future and devise plans to prevent churn and maximize retention.
- Loyal customers might churn due to unnoticed challenges. By finding out early symptoms invisible to fundamental analytics, you can:
Retail churn customers: Address pain points before they increase.
Segment customers: Split your customers into granular segments according to predictive factors; this allows you to find groups with greater churn probability. - Unforeseen churn prediction uses behavioral analytics and machine learning to:
A. Evaluate customer reviews, interactions, and feedback to find negative sentiment.
B. Work on external market changes that could affect a customer’s decision to churn.
Segment your customers based on their value
- EA makes it easy for you to activate your CLV data within the platform, allowing you to segment your customers by their lifetime value and send automated personalized campaigns to those different segments.
- By grouping customers, you can see greater conversion rates and customer loyalty. For example, businesses focusing on greater customer retention usually report a 20-30% rise in CLV.
- With Express Analytics’ automated segmentation engine, companies don’t need to rely on manual filter options and inspect customer categories to focus their audience.
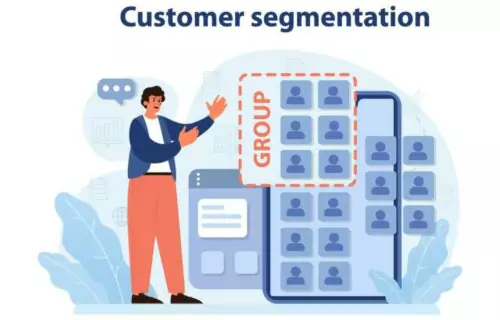
Apply customer segmentation to acquire new customers
Transform the way you look at Sales Data with our Customer Lifetime Value (CLV)
With CLTV insights, you can :
- Forecast future revenue based on current customer behaviors and CLTV
- Determine affordable customer acquisition costs (CAC) to maximize profitability
- Understand payback periods for your marketing efforts
- Identify who your highest-value customers are
Understand the revenue potential for each customer segment - Optimize marketing channels to attract and retain high-value customers
- Make smarter decisions on how much to invest in acquisition costs

Our Customer Lifetime Value Solutions
Reports that can be generated through CLTV Models
| Report Type | Description | Example |
| CLTV Distribution Report | Shows the distribution of CLTV across different customers or segments, identifying high, medium, and low-value customers. | Example: 20% of customers have a CLTV > $2,000, while 50% have a CLTV between $500 and $2,000. |
| Customer Segmentation Report | Segments customers based on their CLTV and behavioral patterns, helping businesses target them more effectively. | Example: Customers are segmented into high-value (CLTV > $1,500), medium-value ($600-$1,500), and low-value (< $600) segments. |
| Revenue Forecast Report | Estimates future revenue based on current CLTV data, giving projections over time. | Example: Predicted revenue for the next year is $1.2 million based on current average CLTV of $1,200 and expected customer retention. |
| Churn Impact Report | Analyzes how churn affects CLTV and predicts the impact of reducing churn on future revenue. | Example: Reducing churn by 5% could increase average CLTV by $300, leading to an additional $500,000 in revenue. |
| Customer Acquisition Cost (CAC) vs. CLTV Report | Compares the cost of acquiring customers with their lifetime value, providing insights into marketing ROI. | Example: The average cost to acquire a customer is $100, while the average CLTV is $1,200, yielding an ROI of 12:1. |
| Retention and Loyalty Report | Identifies trends in customer retention and loyalty based on their CLTV, offering insights into improving engagement. | Example: Customers with high retention rates have an average CLTV of $1,800, while churn-prone customers have a CLTV of $600. |
| Marketing Channel Effectiveness Report | Assesses the effectiveness of different marketing channels in terms of the CLTV of customers acquired through them. | Example: Customers acquired through social media have an average CLTV of $1,500, while those acquired through email marketing have a CLTV of $1,200. |
| Customer Behavior Report | Analyzes purchasing behavior, frequency, and spending patterns to correlate with CLTV levels. | Example: High-value customers (CLTV > $1,500) make purchases 4 times a month, while low-value customers (< $500) purchase once every 2 months. |
| Trend Analysis Report | Tracks changes in CLTV over time, providing historical data to spot growth or decline patterns. | Example: CLTV has increased by 10% year-over-year due to improved customer retention efforts. |
| Customer Value Forecast Report | Forecasts the future value of existing customers based on current CLTV trends. | Example: The average CLTV is predicted to grow from $1,200 to $1,500 over the next 12 months due to enhanced loyalty programs. |
What Questions Does the Customer Lifetime Value Model Resolve for Clients?
- Who are my most valuable customers?
- What is the expected revenue from a customer over their lifetime?
- How much can I afford to spend to acquire a customer?
- Which marketing channels bring in the most valuable customers?
- How does customer churn impact my revenue?
- What is the future revenue potential of my existing customer base?
- How does customer behavior influence their lifetime value?
- How can I increase the CLTV of my customers?
- What is the payback period for customer acquisition costs?
- What segments of my customers have the highest retention?
To get answers to these questions, fill out this contact form.
- Who are my most valuable customers?Identifies customers who provide the highest long-term value to the business.
Example : Customers with a CLTV of $2,000+ are identified as the most valuable, making up 20% of the customer base but contributing to 50% of revenue. - What is the expected revenue from a customer over their lifetime?
Estimates how much revenue a customer will generate over their relationship with the company.
Example : A fitness app estimates that a typical subscriber will generate $1,500 in revenue over 3 years. - How much can I afford to spend to acquire a customer?
Provides insight into the allowable Customer Acquisition Cost (CAC) based on CLTV to ensure profitability.
Example : If a customer has an average CLTV of $1,200, the company can afford to spend up to $300 to acquire them while maintaining a 4:1 ROI. - Which marketing channels bring in the most valuable customers?
Shows which channels bring in high-CLTV customers, helping optimize marketing spend.
Example : Customers acquired via Google Ads have an average CLTV of $1,800, while those acquired through social media have a CLTV of $1,200. - How does customer churn impact my revenue?
Demonstrates how customer churn affects overall business revenue and CLTV.
Example : Reducing churn from 15% to 10% would increase average CLTV from $1,000 to $1,300, boosting overall revenue by $500,000. - What is the future revenue potential of my existing customer base?
Projects how much revenue the current customers will generate in the future based on their CLTV.
Example : The current customer base of 5,000 users is expected to generate $4 million in the next 3 years. - How does customer behavior influence their lifetime value?
Analyzes purchasing frequency, average order value, and engagement to understand CLTV drivers.
Example : Customers who make purchases every month have a 30% higher CLTV compared to those who purchase quarterly. - How can I increase the CLTV of my customers?
Provides strategies to increase customer value through upselling, cross-selling, or loyalty programs.
Example : Implementing a loyalty program is expected to increase average CLTV from $1,200 to $1,500. - What is the payback period for customer acquisition costs?
Determines how long it takes to recover the cost of acquiring a customer based on their CLTV.
Example : With a CLTV of $1,500 and an acquisition cost of $250, the payback period is expected to be 4 months. - What segments of my customers have the highest retention?
Identifies customer segments with the highest retention rates, leading to higher CLTV.
Example : High-value customers in the premium tier have a retention rate of 85%, while lower-value customers have only 40% retention.


