Tired of confusing and tedious dashboards? Our analysts sensibly simplify high volumes of data to make smarter decisions.
Enabling fact-oriented decision intelligence for your business growth.
Data Visualization Services
Convert data into clarity with our data analytics and visualization services

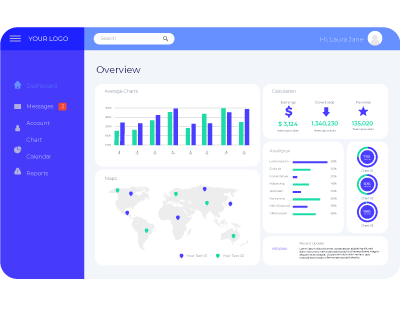
Our Digital Dashboard
- Deliver the latest response to your marketing campaigns & signals of visitors to your web properties.
- Enables you to treat the customer at the appropriate time while they are browsing your website or visiting your physical store.
- Our marketing automation lets you come up with attractive offers to customers on their handheld devices using our proximity marketing services.
Our Predictive Analysis Dashboard
- These predict what’s to come based on present business actions.
- Our data visualization and reporting services can offer an entire staff with clear visuals and dynamic information that empower decisions—large or small—every day.
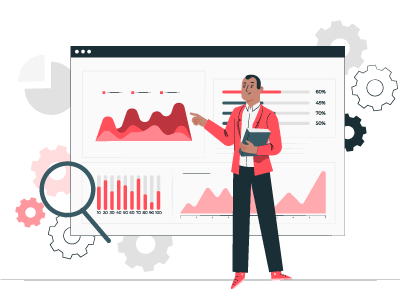
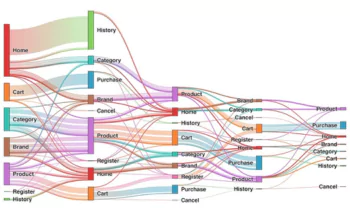
Connect with us to Understand How Sankey Diagrams Visualize the Flow of Data
Our Data Visualization Consulting Services
Data Visualization Use Cases
What are the types of Data Visualization?

Temporal Data Visualizations
One-dimensional and linear visualizations convert your business data into well-defined data pointers.
- Bar charts
- Line graphs
- Scatter plots
- Polar region diagram
- Heatmaps
- Stacked region graph
Hierarchical Data Visualizations
They are perfect for presenting blocks of data. You have to prefer these types of visualizations if you would like to illustrate data links within a process.
- Tree diagrams
- Sunburst chart
- Stacked Bar Chart
- Partition Chart
- Circle packing
Geospatial Data Visualizations
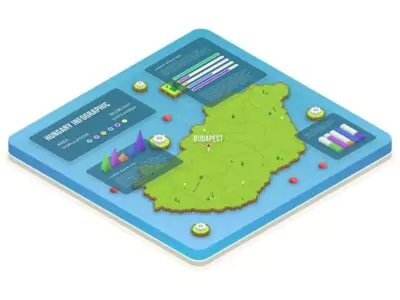
These are some of the previous types of information visualizations, and they don’t need computational skills to build.
- Cluster map
- Cartogram map
- Flow map
- Spider map
- Point map
Multi-dimensional Data Visualizations
These data visualizations allow you to understand multi-layered data by showing it in ways that highlight connections and trends usually invisible in lower-dimensional visualizations.
- Scatter plot
- Dual-axis
- Pie charts
- Bar & stacked bar charts

Our Features
Why Choose Express Analytics for Data Visualization Services?
The Express Analytics ‘Self Service Adhoc Analytics Platform’ is a service that enables businesses to create reports on their own without having any dependency on IT teams saving them upfront investments.
Using this discovery platform, & its in-built advanced data visualization techniques, Enterprises can recognize hidden patterns in their data, which may shed new light on your business issues.
Some of the other features provided by the platform include slicing & dicing of data at any level & a flexible interface with easy-to-use point, & click, drag & drop capabilities. Professional data visualization services provided by us contain technology consulting, execution, and support to develop intelligent reports.

