Overview
The RFM (Recency, Frequency, Monetary) analysis is a powerful tool for understanding customer behavior and segmenting customers based on their purchasing patterns.
[ez-toc]
It is based on three key metrics:
- Recency: How recently a customer made a purchase
- Frequency: How often a customer makes purchases
- Monetary: How much money a customer spends on purchases
This analysis helps businesses identify their most valuable customers, tailor marketing strategies, and optimize customer relationship management.
Approach
Our approach to RFM analysis involved the following steps:
Exploratory Data Analysis (EDA)
RFM Metrics Calculation
RFM Scoring
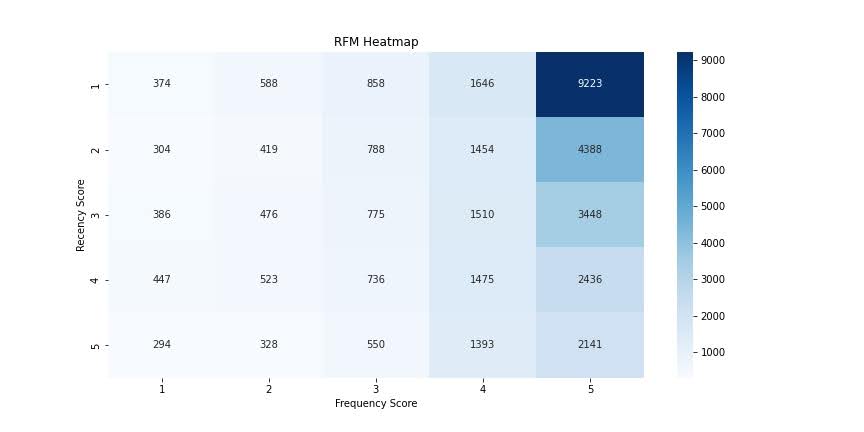
Fig 1. A heatmap showing the distribution of customers across different RFM score combinations
Customer Segmentation using various clustering algorithms
Model Evaluation and Comparison
Customer Profiling
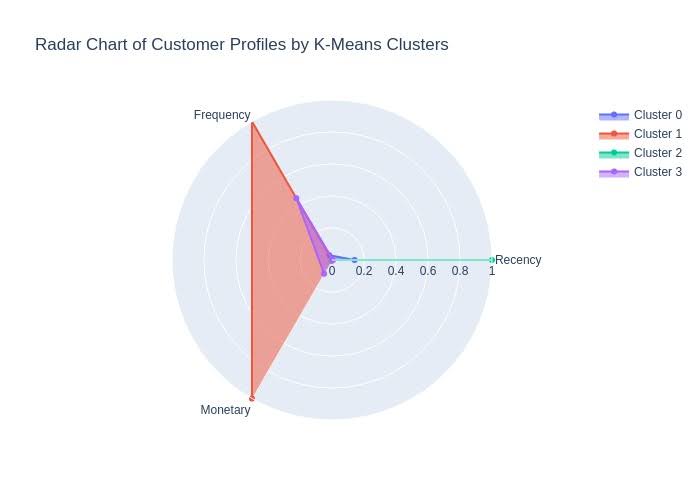
Fig 2. Radar Chart of Customer Profiles to compare the characteristics of each customer segment
Sources
The analysis was performed on the Online Retail dataset, which is a transactional data set which contains all the transactions occurring between 01/12/2010 and 09/12/2011 for a UK-based and registered non-store online retail.
The company mainly sells unique all-occasion gifts. Many customers of the company are wholesalers. The dataset includes information such as:
- InvoiceNo
- StockCode
- Description
- Quantity
- InvoiceDate
- UnitPrice
- CustomerID
- Country
Win New Customers with Customer Journey Mapping
Algorithms Used
[subscribe_to_unlock_form]
K-Means Clustering
Purpose: K-Means is used to partition customers into distinct groups based on their RFM scores, aiming to minimize within-cluster variance.
Method: The optimal number of clusters was determined using the Elbow Method, resulting in 4 clusters.
The algorithm iteratively assigns customers to the nearest cluster centre and adjusts these centre’s to minimize the variance within each cluster.
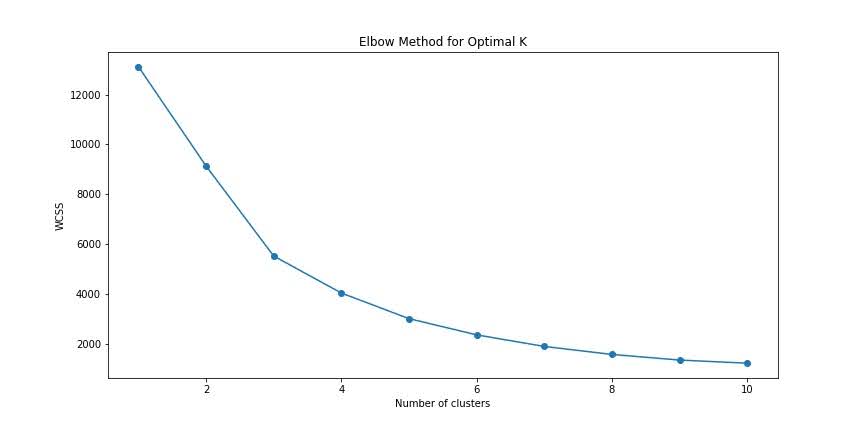
Fig 3. Elbow Method – the approach used to identify the optimal number of Customer Clusters.
Result: The K-Means clustering produced well-defined groups, with a Silhouette Score of 0.6114, indicating a good separation between clusters.
Hierarchical Clustering
Purpose: Hierarchical Clustering is used to build a hierarchy of clusters, allowing for a flexible choice in the number of clusters by cutting the dendrogram at different levels.
Method Applied: Ward’s linkage method was employed to minimize the variance within clusters.
A dendrogram was created to visually assess the appropriate number of clusters, leading to a 4-cluster solution.
Result Obtained: The resulting clusters were similar to those from K-Means, with a Silhouette Score of 0.5893.
This method provided a clear visual representation of the customer hierarchy.
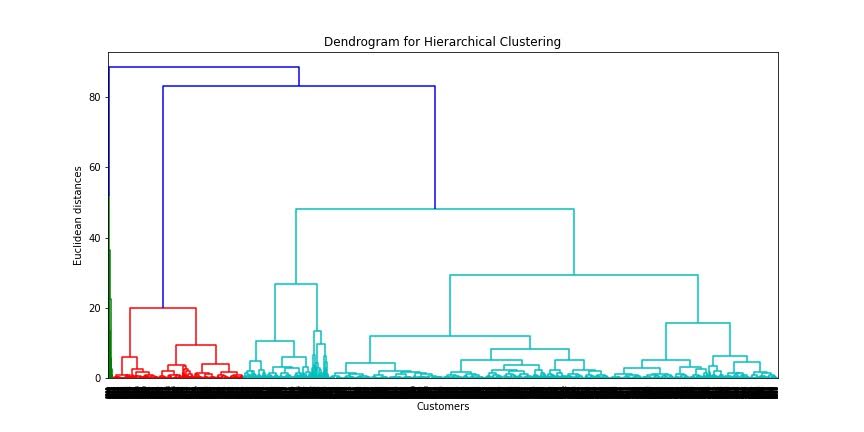
Fig 4. Dendrogram for Hierarchical Clustering showcasing the hierarchical relationships between customers
DBSCAN Clustering
Purpose: DBSCAN (Density-Based Spatial Clustering of Applications with Noise) identifies clusters of varying shapes and sizes while also recognizing outliers as noise, which is particularly useful for identifying anomalous customer behaviors.
Method Applied: DBSCAN was applied with an epsilon of 0.5 and a minimum sample size of 5.
The algorithm clusters customers based on density, with points in dense regions forming clusters, while sparse regions are considered noise.
Result Obtained: DBSCAN achieved a Silhouette Score of 0.6561, effectively identifying core clusters and outliers.
It proved to be useful in distinguishing customers with unusual purchasing patterns.
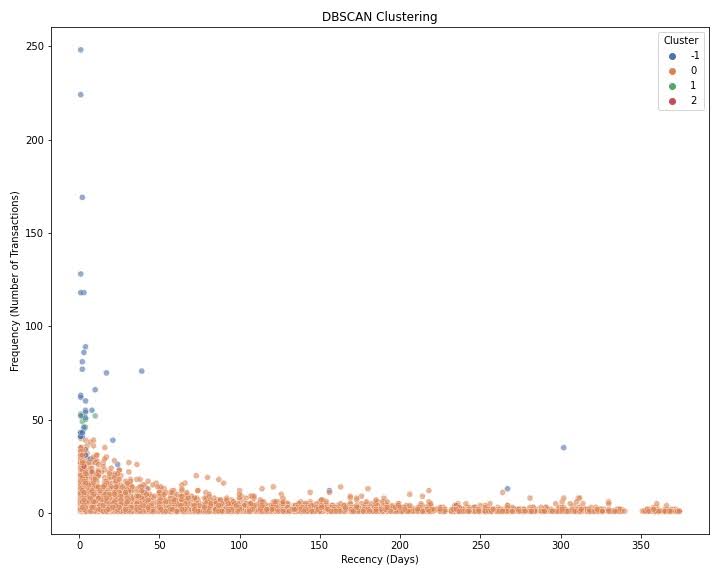
Fig 5. DBSCAN Clusters depicting the identified clusters and noise points
Gaussian Mixture Model
Purpose: GMM is used to model the data as a mixture of multiple Gaussian distributions, offering a probabilistic approach to cluster assignment, which allows for soft clustering.
Method Applied: The algorithm was applied with 4 components, representing the number of clusters.
GMM estimates the probability that each customer belongs to a particular cluster, providing a flexible clustering solution.
Result Obtained: The GMM produced a Silhouette Score of 0.1213, which was lower than the other methods, indicating some overlap between clusters.
However, it offered valuable insights into the probabilistic nature of customer behavior.
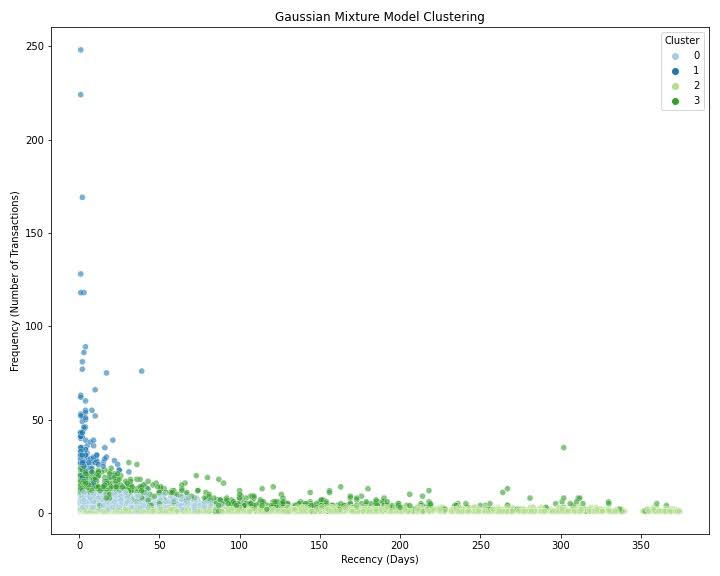
Fig 6. GMM Clusters depicting the overlap between clusters based on Probability
Decision Tree Classifier
Purpose: Decision Trees are used in RFM analysis to create interpretable rules for customer segmentation.
By analyzing the RFM data, Decision Trees identify key thresholds for Recency, Frequency, and Monetary values that can be used to classify customers into different segments.
Method: A Decision Tree classifier was trained on the RFM data, with the customer clusters (from K-Means) as the target variable.
The tree was pruned to avoid overfitting, ensuring that the resulting rules were both accurate and generalizable.
Result:
- The Decision Tree produced a set of clear, interpretable rules that can be used to classify new customers based on their RFM scores.
- The structure of the tree revealed the most important features and thresholds for distinguishing between different customer segments.
- The confusion matrix showed that the Decision Tree performed well in classifying customers into their respective clusters, with a high accuracy rate.
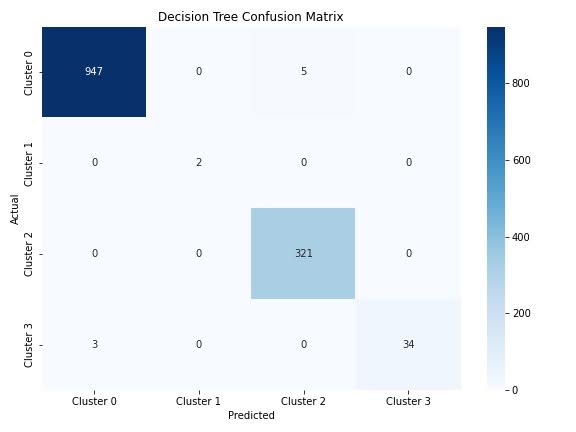
Fig 7. The confusion Matrix gives a comparison between actual and predicted values. The balanced performance across all segments means that the model can be confidently used for customer segmentation based on RFM Scores.
Win New Customers with Customer Journey Mapping
Model-Wise Conclusion
K-Means Clustering
Performance: K-Means provided well-separated clusters with a high silhouette score, making it a reliable method for segmenting customers.
Cluster Insights:
- Cluster 1 (High Value): Customers with high frequency and monetary value but low recency, ideal for loyalty programs.
- Cluster 2 (Low Value): Customers with low frequency and monetary value, suitable for re-engagement strategies.
Hierarchical Clustering
Performance: Hierarchical clustering also provides well-defined clusters, similar to K-Means, and is useful for cases where a dendrogram is needed for better cluster understanding.
DBSCAN Clustering
Performance: DBSCAN effectively identified noise and outliers, resulting in a high silhouette score.
However, it may not be ideal for datasets with continuous customer engagement.
Gaussian Mixture Model
Performance: GMM provided more flexible clustering but had the lowest silhouette score, indicating less distinct clusters.
[/subscribe_to_unlock_form]
Result Summary
- RFM Scoring successfully categorized customers based on their Recency, Frequency, and Monetary values.
- K-Means and Hierarchical Clustering provided the most interpretable and well-separated clusters.
- DBSCAN showed the highest silhouette score, indicating its effectiveness in identifying distinct customer groups.
- The Decision Tree Classifier demonstrated high accuracy in predicting K-Means clusters, offering interpretable rules for customer segmentation.
- Customer profiles were created based on the K-Means clusters, revealing distinct characteristics for each segment.
Recommendations
Focus on High-Value Customers
Action: Prioritize marketing efforts and personalized services for customers in clusters with high Frequency and Monetary values.
Rationale: Customers who frequently purchase and have a high monetary value represent the most profitable segment of the customer base.
By focusing marketing efforts on these high-value customers, you can increase their loyalty, maximize their lifetime value, and encourage repeat purchases.
Re-Engagement Campaigns
Action: Design targeted campaigns for customers with high Recency scores to bring them back to active status.
Rationale: High Recency scores indicate that a customer has not made a purchase recently.
By targeting these customers with re-engagement campaigns, such as special offers or personalized messages, you can encourage them to return and make new purchases, thereby reducing churn and increasing retention.
Cross-Selling and Upselling
Action: Utilize the customer profiles from different clusters to identify opportunities for cross-selling and upselling products.
Rationale: By understanding the purchasing behavior and preferences of each customer segment, you can tailor your cross-selling and upselling strategies.
This not only increases the average order value but also enhances customer satisfaction by offering relevant products that meet their needs.
Loyalty Programs
Action: Develop or refine loyalty programs based on the characteristics of the most valuable customer segments.
Rationale: Loyalty programs can significantly increase customer retention and lifetime value, particularly for high-frequency and high-monetary customers.
By offering rewards and incentives that appeal to these segments, you can foster long-term loyalty and encourage ongoing engagement.
Personalized Marketing
Action: Use the Decision Tree rules to create easily interpretable customer segments for tailored marketing strategies.
Rationale: Decision Trees provide clear rules for segmenting customers based on their RFM scores.
These rules can be used to design personalized marketing strategies that are more likely to resonate with each segment, leading to higher conversion rates and better customer experiences.
Churn Prevention
Action: Monitor customers moving towards higher Recency scores and implement retention strategies.
Rationale: Customers with increasing Recency scores are at a higher risk of churning.
By identifying these customers early and implementing retention strategies—such as targeted offers, personalized outreach, or loyalty incentives—you can reduce the likelihood of losing them and maintain their engagement with your brand.
Regular Analysis
Action: Conduct RFM analysis periodically to track changes in customer behavior and adjust strategies accordingly.
Rationale: Customer behaviors and market conditions change over time.
Regular RFM analysis allows you to stay updated on these changes, ensuring that your marketing strategies remain effective and aligned with current customer needs and preferences.
Integrate with Other Data
Action: Combine RFM analysis results with other customer data (e.g., demographics, product preferences) for more comprehensive insights.
Rationale: RFM analysis provides valuable insights, but combining it with additional data can offer a more holistic view of your customers.
This integration allows for more accurate segmentation and personalization, ultimately leading to better-targeted marketing efforts and improved customer satisfaction.
Test and Iterate
Action: Continuously test different marketing approaches for each customer segment and refine strategies based on results.
Rationale: Not all marketing strategies will work equally well for every segment.
By testing different approaches and analyzing the results, you can identify the most effective strategies for each segment and refine your tactics to maximize their impact.
Use Behavioral Modeling to Acquire New Customers
Customer Journey Mapping
Action: Use RFM insights to improve the overall customer journey and experience across different touchpoints.
Rationale: Understanding where each customer segment is in their journey allows you to optimize their experience at every touchpoint.
By applying RFM insights to customer journey mapping, you can enhance engagement, satisfaction, and loyalty by ensuring that customers receive the right message at the right time.
The RFM Model is a tool businesses use to understand their customers by looking at three key factors:
Recency (R): How recently a customer made a purchase.
Frequency (F): How often they make purchases.
Monetary (M): How much money they spend.
Let’s break this down with a simple example:
Example:
Imagine you own an online clothing store. You have three customers:
Customer A: Bought something last week, buys clothes every month, and usually spends $100 per order.
Customer B: Bought something six months ago, buys once a year, and spends $200 per order.
Customer C: Bought something three months ago, buys every few months, and spends $50 per order.
How RFM Model Works?
- Recency: Customer A is the most recent buyer, followed by Customer C. Customer B bought a while ago, so they’re considered less “recent.”
- Frequency: Customer A buys the most often, making them the most frequent shopper. Customer C is in the middle, and Customer B buys the least frequently.
- Monetary: Customer B spends the most per purchase, but since they don’t buy often, Customer A is considered more valuable overall.
How is RFM Model Useful?
The RFM model helps you figure out which customers are the most valuable and which ones might need more attention. In our example:
- Customer A is a loyal, high-value customer—they buy often, spend regularly, and have bought recently. You might reward them with special offers to keep them coming back.
- Customer B spends a lot but rarely buys—maybe a reminder or promotion could get them to purchase more often.
- Customer C is somewhat engaged but not as valuable—targeting them with offers to increase frequency or spending could boost their value.
Why Use RFM Model?
Using the RFM model helps you focus your marketing efforts on the customers most likely to respond. Instead of sending random promotions to everyone, you can:
- Offer loyalty rewards to frequent buyers.
- Send re-engagement emails to those who haven’t bought in a while.
- Encourage bigger purchases by offering discounts or free shipping to high spenders.
This personalized approach saves time and money while helping you retain your best customers and improve sales.
Data Sources Required for RFM:
| Data Type | Description | Source | Example |
| Transaction Data | Records of customer purchases, including dates and amounts. | Internal sales system, POS system, e-commerce platform | Date of purchase, order amount, order ID |
| Customer ID | Unique identifier for each customer to track their transactions. | CRM, e-commerce platform | Customer ID, email address, phone number |
| Purchase Date | Date and time of each transaction to calculate Recency. | Sales database, order history | Last purchase date: 2024-09-01 |
| Number of Purchases | Total count of purchases per customer for Frequency. | CRM, sales database | Customer A: 5 purchases in the last 12 months |
| Total Spend Amount | The sum of all purchases made by a customer to calculate Monetary value. | Sales database, accounting software | Total spent by Customer A: $500 |
| Customer Segments | (Optional) Customer profiles to categorize by demographics or behavior. | CRM, marketing database | High-spending customers, frequent buyers, occasional shoppers |
Output that can be generated through RFM:
| Output Type | Description | Example |
| RFM Scores (Individual Scores) | Each customer is assigned a score for Recency (R), Frequency (F), and Monetary (M) on a scale (e.g., 1-5). | A customer receives an RFM score of 5-4-3, meaning recent buyer (5), buys often (4), moderate spender (3). |
| Customer Segments | Customers are grouped into segments based on their RFM scores. | – Best Customers (5-5-5): Frequent buyers, high spenders, recent purchases. |
| – At-Risk Customers (1-3-2): Have not bought recently, infrequent purchases. | ||
| Customer Segmentation Report | Categorized list of customers based on RFM score combinations. | – Segment 1: Best customers (R=5, F=5, M=5). |
| – Segment 2: At-risk customers (R=1, F=3, M=2). | ||
| Actionable Insights | Clear strategies for different customer groups based on RFM scores. | – Best Customers: Offer loyalty rewards or exclusive offers. |
| – At-Risk Customers: Send reminders or discount offers to re-engage. | ||
| Visualization/Dashboard | Visual representation of customer distribution based on RFM scores. | A heatmap showing customer groups, e.g., best, loyal, at-risk, churned, and their proportions. |
Reports that can be generated through RFM Models
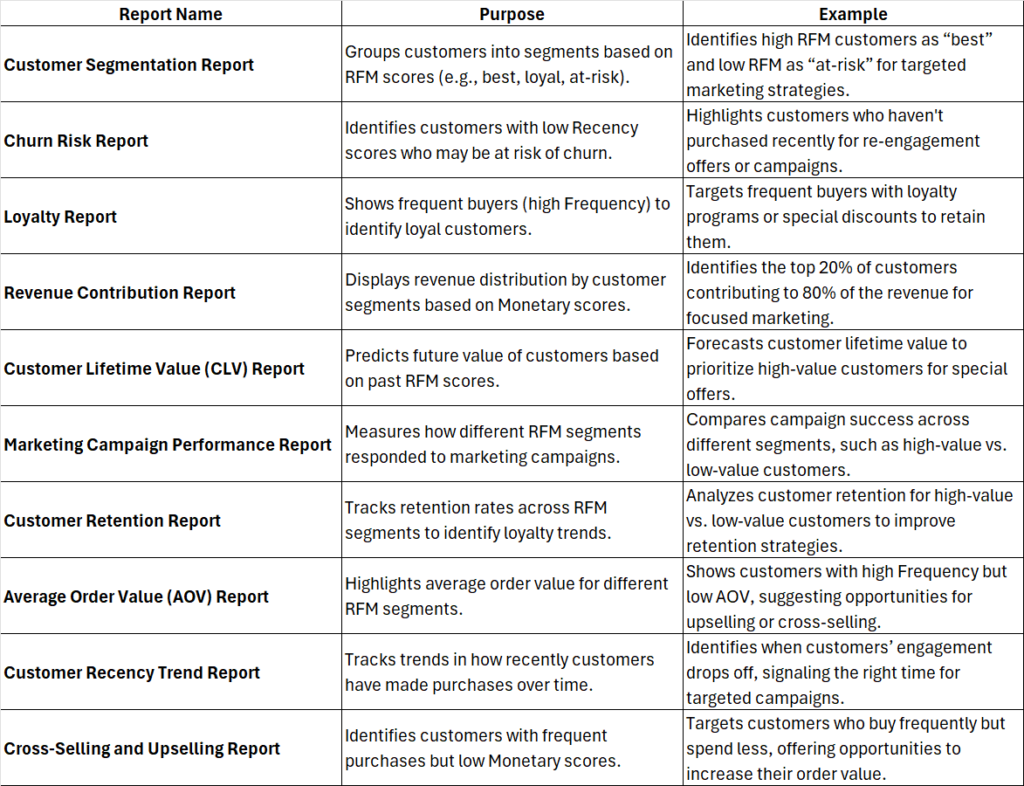
What Questions does RFM Resolve for Client:
| Question | RFM Focus | Resolved Insight |
| Who are my best customers? | High Recency, Frequency, and Monetary scores | Identifies the most valuable customers who frequently purchase, spend a lot, and have made recent transactions. |
| Which customers are at risk of churning? | Low Recency, moderate Frequency, and Monetary scores | Pinpoints customers who haven’t purchased recently, helping to target them with retention strategies. |
| Who are my most loyal customers? | High Frequency, moderate Recency, and Monetary scores | Highlights frequent purchasers, indicating the need for loyalty rewards or exclusive offers. |
| Which customers spend the most money? | High Monetary scores | Identifies customers with the highest spending, focusing on maximizing these relationships. |
| Which customers need re-engagement? | Low Recency, varying Frequency and Monetary scores | Reveals customers who haven’t purchased recently but were valuable, suggesting the need for re-engagement. |
| Who are the potential high-value customers? | High Recency and Frequency, low Monetary scores | Identifies customers who buy often and recently, but spend less, offering cross-selling or upselling opportunities. |
| Which customers are new and need nurturing? | High Recency, low Frequency, and Monetary scores | Recognizes new customers with recent, low-value purchases, helping develop strategies to nurture them into loyal ones. |
| What is the distribution of revenue across my customer base? | Segmentation based on Monetary scores | Helps understand which segments contribute the most to revenue, guiding resource allocation and marketing focus. |
| Which customers should we avoid investing in? | Low Recency, Frequency, and Monetary scores | Identifies low-value customers to avoid spending resources on, preventing wasteful marketing investments. |
| How can we increase customer retention and spending? | Overall RFM score analysis | Guides the creation of targeted marketing campaigns to increase purchase frequency, spending, and retention. |


Warning: Undefined variable $comments in /bitnami/wordpress/wp-content/themes/expressanalytics/single.php on line 503
Warning: foreach() argument must be of type array|object, null given in /bitnami/wordpress/wp-content/themes/expressanalytics/single.php on line 503