
What is Machine Learning and Machine Learning Techniques: Complete Guide
The process of analyzing data and finding patterns in it to be used for meeting business goals is a generalized way of defining data analytics. But with the flow of data into enterprises growing exponentially over the years, it has become difficult to analyze data by using just the traditional statistical methods.
Also, the vast amounts of data make it almost impossible for human analysts to spot patterns.
That hurdle, however, can now be crossed by introducing machine learning (ML), a subset of artificial intelligence (AI) in data analytics.
Machine learning techniques help automate the process of data analysis by building efficient algorithms (or models) that can unravel the hidden patterns and insights from data.
Table of Contents
- What Is Data Analytics?
- What Is Artificial Intelligence
- What Is Machine Learning
- Machine Learning Today
- How Machine Learning Works In Data Analytics
- Top 10 Machine Learning Techniques You Should Be Aware Of
- What Is Machine Learning Used For In Data Analytics
- Who Is Using Machine Learning In Data Analytics?
- Challenges and Opportunities in Machine Learning
What is Data Analytics?
The analysis of data is a multi-step process that eventually ends in visualizing data to infer insights from the results. Such analytics is today used across almost every industry — in banking, marketing, and stock markets — to name a few.
What is big data machine learning? Once big data — structured and unstructured data — is collected by an enterprise, it has to be analyzed for patterns and insights. This leads to better decision-making within an organization.
Compared to the earlier days, this is also a scientific, evidence-based way of doing business. Big data analysis offers interaction with data that was not possible with the earlier, traditional enterprise business intelligence systems.
Data analytics can be used by businesses in their marketing and sales activities for targeting leads, prospects, and customers with cross-selling and upselling offers.
Transform your business using Express Analytics’ machine learning solutions
What is Artificial Intelligence
Artificial intelligence is a very broad-based discipline that mimics human intelligence and can be used to describe anything from automation to robotics.
AI aims at making a machine more “intelligent” by imparting to it the ability to learn from data.
AI is broadly classified into four different types:
- Reactive Machines AI: This type of AI includes machines that operate solely based on the present data, considering only the current situation. Reactive AI machines cannot form inferences from the data to evaluate their future actions and can perform a narrower range of pre-defined tasks. Ex — Any Chess Engine, like Deep Blue
- Limited Memory AI: Limited Memory AI can make informed and improved decisions by studying past data from its memory. Such an AI has a short-lived or temporary memory that can be used to store past experiences and hence evaluate future actions. Ex – Self-driving cars
- Theory of Mind AI: The Theory Of Mind AI is a more advanced type of Artificial Intelligence. This category of machines is speculated to play a major role in psychology and focus mainly on emotional intelligence so that human beliefs and thoughts can be better understood
- Self-aware AI: In this type of AI, machines have their consciousness and can take decisions independently — like any human being. But this is a very advanced stage of AI
What is Machine Learning
Machine learning is a subset of AI with the narrow purpose of learning from information (data) as far as possible without explicit programming.
ML utilizes numerical and statistical approaches to encode learning in models. Machine learning in data analytics is the new way of designing algorithms that learn on their own from data and adapt with minimal human intervention.
An example would be such a model understanding the difference between a $10 temporary fluctuation and a $100 jump in the price of a company share at any given trading hour.
The ML algorithm is called a model, and the aim, like in traditional data analytics, is to go from data to insights.
An example of machine learning (ML) in day-to-day life is the auto-segregation of spammy emails in your ‘Spam’ folder in your email inbox.
Machine Learning Today
Is machine learning (ML) a new discipline? The answer is no. AI has been around for years but has become commercial only recently. That’s because of advancement in technologies, which has made computing faster and also removed the cost barrier to deployment.
Recent iterations of ML can apply complex mathematical calculations to data faster.
In ML, machines are trained to make computations through repeated usage. They are used to build and automate data analytics models and given tasks such as classification, clustering, and divergence detection.
The idea is to see if computers can learn from data. As ML models progress, they are monitored to check whether the machines are learning independently when exposed to new data.
There is a subset of ML even called “Deep Learning” where such artificial programs, by working on vast amounts of data, uncover newer patterns, through the help of neural networks.
The concept of Neural Networks is inspired by the neurons of the human brain.
Deep learning technologies have proved to be very successful in solving complex problems, that traditional ML algorithms can take a long time to solve, and with a lot of fine-tuning.
One more example of machine learning (ML) in action today is the recommendation engines of Netflix or Amazon Prime that throw up movie recommendations for their viewers.
How Machine Learning Works in Data Analytics
As compared to traditional data analytics, machine learning in data analytics is an entirely different process.
It automates the entire data analysis workflow to provide a more comprehensive set of insights.
Analytics tools like those running on ML are capable of performing the actual laborious work required for data analytics that was once the task of humans.
Mostly, in an unsupervised or semi-supervised manner. Yet, let’s not forget that even in such machine-learning models, it is humans who extract the results of data analysis at the end of the day.
Starting, with machine learning in data analytics, most of the algorithms are either classification-based — where machines classify data — or regression-based, where they forecast values.
Then, there are the two popular machine learning methods that are often deployed by enterprises — supervised and unsupervised algorithms.
Supervised ML algorithms provide class labels for each sample data on the training set. In an unsupervised machine-learning algorithm though, no class labels are provided for the training samples.
These are the two most popular methods of machine learning.
Apart from that, we have a semi-supervised method, which combines a small amount of labeled data with a large amount of unlabeled data during training.
Supervised learning algorithms:
- Training is imparted on input-output pair examples utilizing labels like an input where the resultant output (target variable) is also known
- Data points are labeled here
- The “learning” algorithm then gets a set of inputs along with the compatible correct outputs
- This helps the algorithm learn by matching its own actual output with the right set of outputs to find mistakes
- When given additional unlabeled data, it utilizes methods like classification, regression, prediction, and gradient boosting, to predict the corresponding label values
- Usually used to predict future events based on historical data
- The term supervised is used because the data used to train the model already contains the correct answers mapped with every data record, like a teacher supervising the learning of a student
Unsupervised learning algorithm:
- As compared to its cousin, here the data used for training has no output labels mapped; there’s no “right” output to match the result with
- Unsupervised learning is a type of machine learning algorithm used to draw inferences from datasets consisting of input data without labeled responses
- Human intervention is almost nil or minimal
- It is left to the algorithm to pretty much figure out things, and to model the underlying structure or distribution in the data to learn more about the data
- The “answer” to the problem is not fed into the machine
- Used mostly in unstructured data to find some patterns within
- In marketing, such an unsupervised model works, for example, to segment customers. Also used to identify data outliers.
- The most common unsupervised learning method is cluster analysis, which is used for exploratory data analysis to find hidden patterns or grouping in data
Semi-supervised learning:
- The disadvantage of any supervised learning algorithm is that the dataset has to be hand-labeled either by a data set or accumulated historical data. This is a very costly process, especially when dealing with large volumes of data
- The most basic disadvantage of any unsupervised learning is that its application spectrum is limited
- To overcome this, a new concept of “Semi-Supervised Learning”, usually trained on a combination of small amounts of labeled data and large amounts of unlabeled data
- The basic process first involves clustering similar data and using the labeled data to label the rest of the unlabeled data
- Inelasticity is again the machine that finds out the cause behind the result. It will try to understand which factor is credited with which outcome
As you may have realized by now, machine learning in data analytics involves the use of techniques such as clustering, elasticity, and natural language.
In clustering, it is for the machine to decide the commonalities between the different datasets to understand how certain things are alike.
Natural language, of course, as we have explained before, is for ease of use for normal business users and not coders or analysts.
One does not need to know coding language to perform deep analysis. Queries of your data can be made of machines in any human language.
As we said earlier in this guide, machine learning involves building automated models for data analytics. This means machines are tasked with classification, clustering, and anomaly detection.
In some algorithms, without relying on programming, algorithms decide the output on the detection of any change in a pattern.
Transform your business using Express Analytics’ machine learning solutions
Top 10 Machine Learning Techniques You Should be Aware of
Here are a few Machine Learning Techniques or methods you must be aware of as a data scientist.
- Clustering
- Distribution-based clustering
- Centroid-based clustering
- Connectivity-based Clustering
- Density-based Clustering
- Linear Regression
- Logistic Regression
- Decision-tree
- Categorical Variable Decision Tree
- Continuous Variable Decision Tree
While there is a clutch of machine learning algorithms out there, let’s look at some basic and popular ones.
Clustering
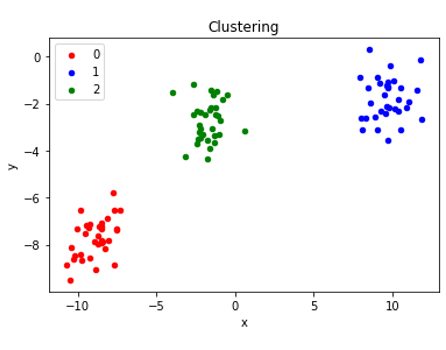
This falls under the category of unsupervised ML. Here, the aim is to group (cluster) people, objects, trends, etc., exhibiting similar characteristics. The model does not require output information while in training.
Here the target is to recognize different patterns present in the data and come up with clusters that have very little variation within themselves. But there should be a high variation between the clusters so that each of the clusters can be identified separately. An example would be developing an algorithm that puts those customers who have always bought red Tees into one cluster and then testing other products with this group to understand what grabs their attention.
Simply put, clustering is the recognition of similarities. One must understand that deep learning does not always require labels to find similarities. When there are no labels provided to learn from, it uses machine learning to learn on its own — which means unsupervised learning. This retains the potential of producing highly accurate models. Examples of clustering can be customer churn.
There are mainly two types of clustering approaches — Hard Clustering and Soft Clustering
In Hard Clustering, a data point (or sample) can belong to only one cluster, out of all the pre-defined clusters. But in Soft Clustering, the output is provided as a likelihood (probability) of a data point belonging to each of the pre-defined clusters. A data point is placed under that cluster which shows the maximum likelihood of containing that data point.
Let’s have a look at the different clustering techniques:
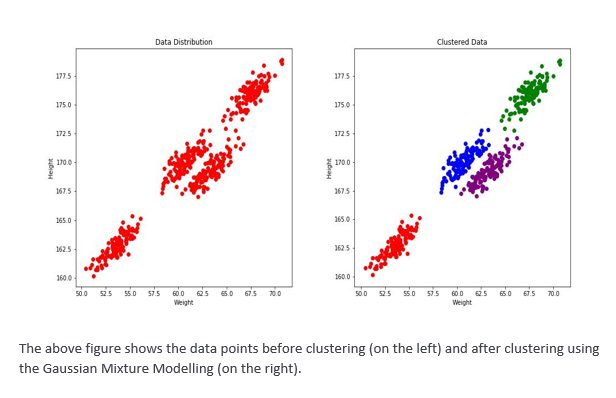
Distribution-based clustering
Here the data points are classified in the same cluster if they belong to the same distribution. The most popular choice for this purpose is the Normal (or Gaussian) Distribution. The Gaussian Mixture Model (GMM), a well-known clustering algorithm, falls under this category. GMM models the data with a fixed number of Gaussian distributions and over repeated iterations, it tries to find out the best set of hyper-parameters that would cluster the data points with minimum error. It uses a statistical algorithm called Expectation-Maximization for this purpose.
Centroid-based clustering
It is basically a Partition based Clustering technique where the number of clusters should be known beforehand. The K-means algorithm, one of the most popular clustering algorithms, falls under this category. Here K stands for the number of clusters. In this algorithm, K data points are chosen randomly from the data set, which is assumed to be the centroids. Those K centroids are initially taken as the K clusters. Using those K clusters, the rest of the data points are classified under that cluster to which it lies the closest.
Obviously, we need a distance function to measure the closeness of the data points from the chosen clusters. So the choice of distance function becomes very important here. The algorithm proceeds over several iterations (which can be set beforehand) and in each iteration, when a new data point is added to a cluster, the cluster mean gets updated accordingly.
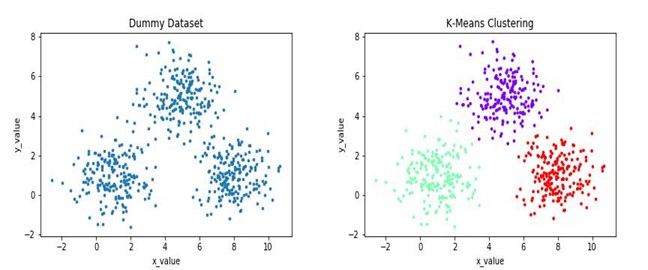
The above image shows a dummy dataset and the results obtained after K-Means clustering. Other variations of K-Means include the K-Medoids algorithm, K-Means++, Weighted K-Means, etc.
Connectivity-based Clustering
This algorithm is one type of Hierarchical Clustering, where data points that are more “similar” to one another should be clustered in the same group. The main idea of Connectivity based model is similar to Centroid-based model, but they differ in the way of how the distance metric is computed. Apart from the popular distance functions like Euclidean, Manhattan, Cosine, etc. this type of clustering uses a concept called “linkage”, which is another way of defining the distance between two clusters. There are 3 types of Linkage algorithms — Single, Complete, and Average.
The Single Linkage technique merges two clusters if the minimum distance, computed over all possible pairs of points in these two clusters, lies below a pre-specified distance threshold.
The Complete Linkage technique merges two clusters if the maximum distance, computed over all possible pairs of points in these two clusters, lies below a pre-specified distance threshold.
The Average Linkage technique merges two clusters if the average distance, computed over all possible pairs of points in these two clusters, lies below a pre-specified distance threshold.
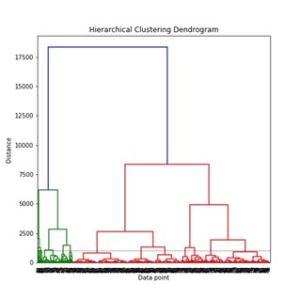
The above image depicts how connectivity-based clustering clusters (or connects) data points that are similar to each other. The above diagram is known as a Dendrogram.
Density-based Clustering
In this clustering model, the data space is searched for areas of varied densities, and data points belonging to similar densities are grouped. There are many advantages of this technique, one of which includes preventing the formation of strip-like clusters that occurs when clusters are grouped based on distance threshold, but they are actually different. This is known as the chaining effect. DBSCAN and OPTICS are the two most popular algorithm that falls under this category.
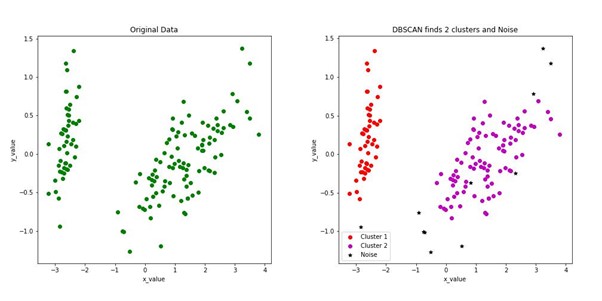
The complexity of DBSCAN is quite low, although it proves to be efficient in many cases. The above image is obtained after applying the DBSCAN algorithm to a dummy dataset. DBCAN identifies the clusters with good accuracy, and also some noisy points in the dataset, that are not part of any cluster.
Linear Regression
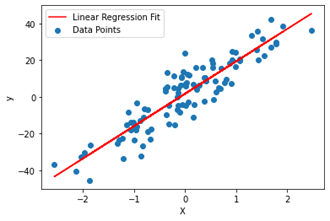
This type of modeling is best suited for finding correlations between variables in data analysis. It is also the most popular machine learning algorithm because of its ease of use. This machine-learning algorithm consists of fitting the dataset in a linear equation that combines a specific set of input variables (x) to the solution of the predicted output for that set of inputs (y). A specific coefficient in the form of a scalar value is assigned to each input variable by the equation.
Linear regression modeling is based on regression capabilities that change depending on the number of independent variables and the type of relationship between the independent and dependent variables. There are two types of linear regression models: simple and multiple linear.
The first is a kind of regression analysis where we find a linear relationship between a single independent (input) variable and a single dependent (output) variable and the second involves two or more independent variables and one dependent variable.
The following graph represents a simple linear regression fit between an input variable(x) and output variable (y).
Logistic Regression
Linear regression algorithms look for correlations between continuous variables innately. On the other hand, logistic regression is used for classifying categorical data. It is yet another technique borrowed from the field of statistics.
Logistic regression is used to solve binary classification problems where there are two class values. A Logistic Regression can be referred to as a Linear Regression model but the former uses a complex cost function which is called the ‘Sigmoid function’ or ‘logistic function’ instead of a linear function. The sigmoid function plots any real value into an alternate value in the range 0 to 1. In machine learning, the sigmoid (the S-shaped curve) is employed to map projections to probabilities.
Using logistic regression, you can make simple predictions to forecast the probability that an observation belongs to one of two possible classes. An example would be to look at historical records of a bank customer to understand whether he may or may not default on his loan repayments.
Multi-class classification is also supported with logistic regression by using one v/s rest scheme. In the one v/s all method, while working with one class at a time, that class is denoted by 1 and the remaining by 0 and their results are combined to get the final fit.
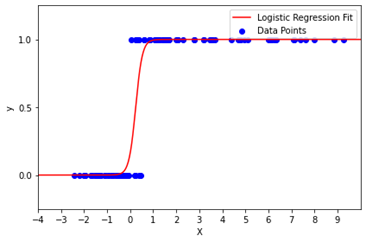
As shown in the figure above, the logistic regression model classifies all points below the sigmoid curve in one category and above the curve to another
Decision-tree
The Decision-tree model falls under the supervised learning category. But unlike other supervised learning algorithms, this particular algorithm can even be used for solving regression and classification problems. It is largely used to help decide about any process.
This model is basically a rule-based approach where a tree-like structure is created. Learning starts from the top of the tree (i.e. the root node). Each node basically consists of a question, to which the answer is positive or negative. The questions at different levels are related to the different attributes in the dataset. Based on the answers at different levels of the tree, the algorithm concludes as to what should be the output corresponding to the input sample.
It is a very popular algorithm, mainly due to its simplicity. The benefit of this algorithm is that for some input samples, it can predict the output quickly, without even traversing a major portion of the tree. But that depends entirely on the dataset.
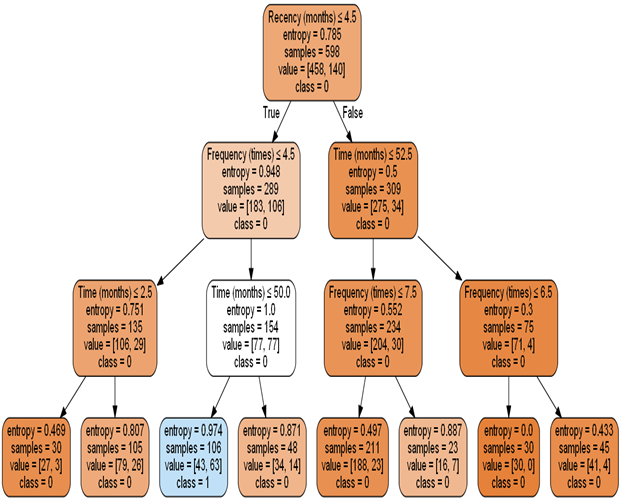
The above diagram represents a decision tree that predicts whether a patient has donated blood based on Recency, Frequency Monetary, and Time. The dataset can be found here.
Depending on the kind of target variables, Decision-trees come in two types:
Categorical Variable Decision Tree
In this type of Decision Tree, the output is the category (or class) to which the test sample belongs. This type of tree is called the Classification Tree. Ex: Deciding whether a customer will turn out to be a loan-defaulter.
Continuous Variable Decision Tree
In this type of Decision Tree, the output is a real number corresponding to a test sample. This type of tree is called a Regression Tree. An example of this would be to try and understand whether to invest in a certain company’s shares or not. What is also required for that is all possible variables.
Some techniques, often called ensemble methods, construct more than one decision tree. Ensemble learning involves combining the decisions of multiple weak learners (or models) to produce one strong learner. In most cases, a single Decision Tree alone is not sufficient to provide good accuracy. So general practice is to use multiple Decision Trees to come up with one strong algorithm.
What is Machine Learning Used for In Data Analytics
In one line, to analyze big data in a speedier and more in-depth manner. Here are some of its uses:
Deciphering patterns: Machine learning data analytics can help decode trends in certain businesses or sectors. It can help identify diseases in the initial stage among patients, for example. Or unearth the buying patterns of consumers in a certain geography. Machine learning can help interpret consumer patterns and behaviors accurately. Media and the entertainment industry use machine learning data analytics to understand the likes and dislikes of their audiences and to send out targeted content.
Understanding customer behavior and segmentation: User modeling is big with machine learning data analytics. Businesses can use it to explore customer behavior. It can mine data to capture the mind of the client to make intelligent decisions.
Customer segmentation can help you in many ways: It helps a business develop focused strategies to hold on to its top-paying customers. Or, to re-engage those clients who haven’t purchased in a while. It is also used to provide a heightened customer experience.
Help in decision-making: Using time-series analysis, machine learning in data analytics can aid an enterprise’s decision-making framework by aggregating and analyzing data. Machine learning-based modeling techniques can give reliable insight into a consumer’s persona to help predict behavior. It can help businesses make insightful marketing decisions.
Who is Using Machine Learning in Data Analytics?
Needless to say, almost every field or industry that relies on data is using or can use data analytics, and consequentially, deploy machine learning. From financial institutions to governments, from the medical world to retail, including e-commerce, you can find machine learning being deployed there.
- Healthcare: Machine learning can be used in the diagnosis of diseases, medical research, and therapy planning. It can be utilized in the prognosis of cancer, for example. It can be used to analyze data from wearable devices and sensors, and to flag likely hurdles to arise while a patient is being medically treated.
- Financial Institutions: Machine learning-based models can be a great asset for financial institutions such as stock markets, banks, and credit card businesses. Today it’s used for two main reasons: to get insights from financial data, and to prevent financial fraud. Machine learning can help FIs to track customer spending patterns, or to perform stock or currency market analysis.
- Retail: This is where machine learning was deployed at the earliest. E-commerce Sites, for example, use machine learning in data analytics to recommend items you might like based on your previous purchase history. It is machine learning again that helps analyze the copious amounts of customer-related data, including likes and dislikes, previous purchases, and so on, to help personalize the shopping experience, or to implement a marketing campaign.
Machine learning can also be used to increase customer engagement while they are browsing through online catalogs to increase engagement and impact conversion rates.
Then, of course, there are recommender systems that are used to increase sales by offering highly personalized offers. These also help speed up searches to make it easy for customers to access the content they are interested in.
Transform your business using Express Analytics’ machine learning solutions
Challenges and Opportunities in Machine Learning
Here are a few challenges and opportunities in machine learning. The biggest entry to the barrier for machine learning-based data analytics is the mindset of enterprises. If eventually, your business does decide to go ahead with machine learning data analytics, what is required first and foremost is a change in management fundamentals.
While its potential gains do hold appeal, companies that plan to invest in such machine learning-based advanced analytics solutions must ask themselves this one basic question: do we really need it?
Many organizations can benefit by using traditional data analytics without the use of complicated ML applications. In many cases, traditional data analysis is enough to do the job. You can generate reports of what’s happened in the past, or of what’s happening today.
If your business really has vast repositories of big data, and making sense of it is all beyond the scope of your team of human analysts, then deploying machine learning in analytics is better.
By: Anubhav Sarkar and Mehar Singh Gambhir