Graph Analytics: Reasons Why More Businesses are Adopting It
Studies show that between 2019 and 2020, a sizeable number of businesses adopted graph-related technologies.
Indeed, one such report has predicted that the global graph analytics market size was expected to grow from US$584 million in 2019 to US$2,522 million by 2024.
This was at a Compound Annual Growth Rate (CAGR) of 34.0% during the forecast period.
So why this interest? Graph analytics can deliver what traditional data analytics cannot, and in real-time, thus saving enterprises, time.
Traditional data analytics feeds on unprocessed data, structured as well as unstructured, and as compared to graph analytics is a laborious process with limitations.
That’s because SQL and other NoSQL databases do not have the robustness to handle complex data. With the volume of data flowing into enterprises increasing every day, analytics can become quite a challenge.
What is Graph Analytics
Graph analytics is a set of analytic techniques that looks for relationships between entities of interest via an abstraction called “graph model”. Who are these entities? They can be customers, products, or even operations.
What graph analytics does is establish relationships between these entities, something that the traditional method almost cannot.
The graph model is suited to allow a broad range of analyses otherwise not available to those using a standard data warehouse.
Connect with us to understand how we can help you achieve business success using graph analytics
From the ground-up itself, graph databases take a relationships-first approach to data, thus differentiating themselves from other analytical techniques.
This also helps global businesses which have adopted graph analytics add context to their decision-making.
If readers may recall, in an earlier blog post, we had written about how graph analytics is used to build recommender systems of the likes used by Amazon and Netflix. There are other uses, too, but we’ll get to those later.
Some Advantages of Graph Analytics:
- It shaves off time in data organization and requires less effort in data analytics processes like the merging of data sources
- Is visually appealing and easier to understand than other data analytics boards
- Can even find indirect relations between edges, helping in handling large and complex data
- Allows the addition of any amount of data without doing a lot of modeling in advance
How Does Graph Analytics Work
As the name suggests, in graph analytics, you store, manage and query data in the form of a graph.
Your “entities” or “nodes” become vertices while “edges” are the relationships; these basically denote communication lines between the various entities.
What’s more, an edge can be a line in one or many directions or no direction at all. It also has a “weight” assigned to it that stands for the strength of the relationship.
Here’s a simple illustration: Let’s say a node is an air traveler, Mr. X, while an edge stands for his payment method and his preference for business class.
The ancillary information or attributes that describe a node are called properties.
Thus, using graph analytics, an airline can establish the relationship between Mr. X and his various preferences while traveling.
Even as he turns into a frequent flyer and keeps adding edges, graph analytics can easily handle such additional information.
So, as you may have realized by now, graph analytics allows a business to add any kind of entity and its relationship in a graph model, thus making the process of analytics faster, easier and better.
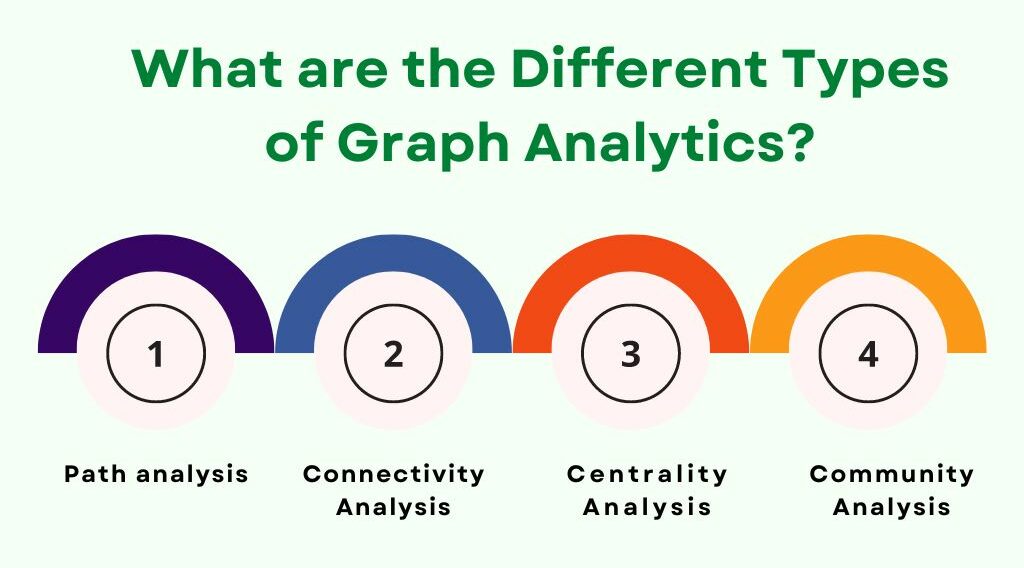
There are Four Types of Graph Analytics:
- Path Analysis: Look at the relationship between nodes or edges. Determines the shortest distance between two nodes.
- Connectivity Analysis: Compares connectivity by understanding the strength of two connected nodes.
- Centrality Analysis: Estimates the importance of a node for connectivity.
- Community Analysis: This is a distance and density-based analysis of relationships used in groups of people, to find such groups that are frequently interacting with each other.
How is Graph Analytics different from Regular Analytics?
Regular analytics is purely dependent on operational exploration, statistics, and computer programming. Graph analytics is based on graph-based algorithms to inspect the connections between entities.
Regular analytics makes use of SQL to recover information and discover the causes of data insights. Various joins in tabular tables result in slow SQL joins. Results from SQL queries can be expected after thousands of milliseconds.
Also, graph analytics uses graph databases, and all the nodes are linked by relationships in a graph database. Thus, it can display quicker outcomes than SQL queries.
Where It Is Used?
The increasing popularity of graph analytics is because of its capacity to include new sources of data and my new relations in the data sets with ease and within a reasonable time.
That is why in the last two years, we’ve seen more global companies adding graph analytics in their analytics portfolios and applications.
Excluding higher education, different industries and categories including marketing, manufacturing, data privacy and regulation, and finance can use graph analytics techniques.
For some time now, graph analytics has been used in social network analysis, fraud detection, supply chains, and search engine optimization.
Fraud detection has become easier with graph analytics. You have to generate a graph from transactions between entities and entities that disclose data including email ids, passwords, etc.
Because of the COVID-19 pandemic, global supply chains lie broken but this form of analytics helps not only to provide a 360 degrees analysis for the supply chain but also on various government policies and factors influencing a particular industry, no thanks to its relationship-first approach.
Graph analytics can be used for supply chain management. Using graph analytics algorithms such as partitioning and shortest path, one can easily optimize routes in supply chain and transportation networks.
As per a Gartner report: … as the world scrambles to respond to current and future pandemics, graph technologies can relate entities across everything from geospatial data on people’s phones to facial-recognition systems that can analyze photos to determine who might have come into contact with individuals who later tested positive for the coronavirus.
Graph analytics can be helpful for Sales teams to identify social media influencers and decision-makers, and thus acquire more leads.
In the healthcare sector, for example, it can be used to find new ways of treatment by analyzing not only the relationship between the patient, his problems, and his medication but also about the effect of his lifestyle choices on his ailment.
Visualize Your Data Like Never Before with Graph Analytics!
For the manufacturing sector, it can optimize logistics by finding out the fastest routes.
Graph analytics has a lot of potentials, but we at Express Analytics feel one of the best use possible is to deploy it to anticipate and deliver to customers even before they want a particular product or service.
This form of analytics helps with hyper-personalization because graph analytics can analyze and contextualize all that is known about a specific customer.
Today, for a business to be successful, it is imperative for it to establish a one-on-one relationship with its customers, and offer timely products or services.
Customer satisfaction eventually helps maximize revenue, and that’s where graph analytics can play a crucial role.
Image by Amilex Clayton Borboran from Pixabay
References:
How Graph Analytics Can Transform Your Business
An Engine That Drives Customer Intelligence
Oyster is not just a customer data platform (CDP). It is the world’s first customer insights platform (CIP). Why? At its core is your customer. Oyster is a “data unifying software
Liked This Article?
Gain more insights, case studies, information on our product, customer data platform